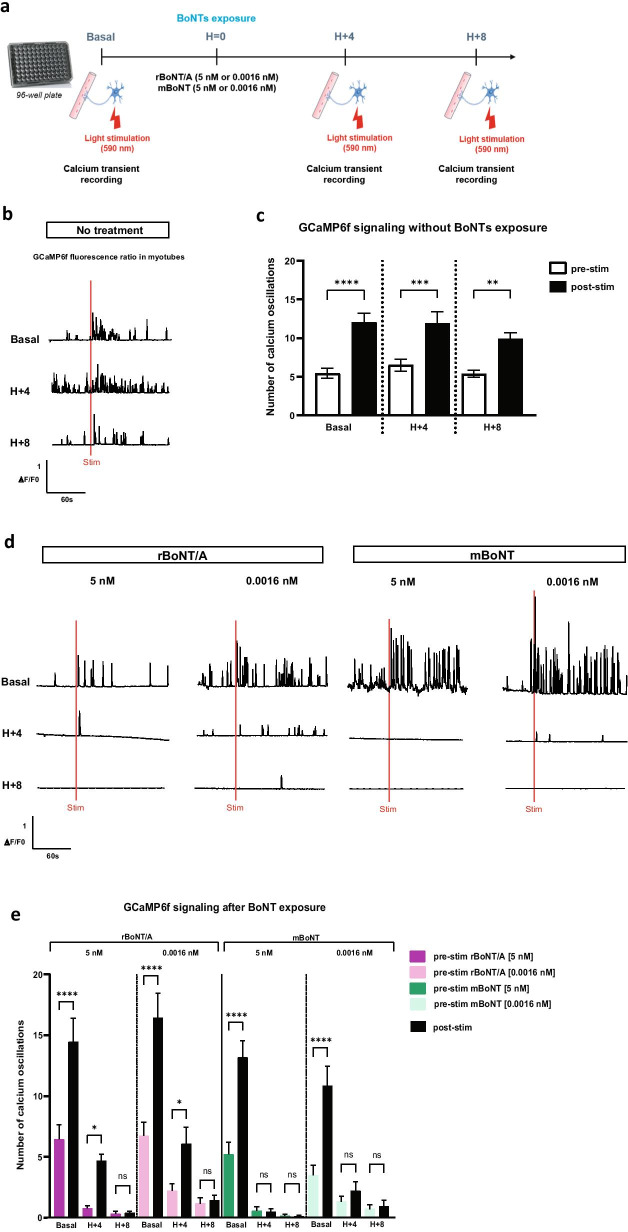
Fig. 4.
BoNTs effects on optogenetic controlled muscle-nerve system. a Representative schema of the optogenetic procedure before (baseline/before treatment) and 4 h and 8 h after exposure of BoNTs (H + 4 and H + 8). The addition of both BoNTs was notified by H = 0. Cells were exposed to two doses (5 nM or 0.0016 nM) of rBoNT/A or mBoNT. b, c Representative traces of normalized GCaMP6f fluorescence in untreated condition before (pre-stim) and after (post-stim) red light stimulation (red bar) over the time and quantification of Ca2+ oscillations. Data are represented as mean ± SEM (N = 2 independent experiments, 3 myofibers/well, 3 wells/condition). ANOVA with Sidak’s post hoc tests (****p < 0.0001; ***p < 0.001; **p < 0.01), each pre-stim recordings were compared to post-stim recordings. d, e Representative traces of normalized GCaMP6f fluorescence at 5 nM rBoNT/A, 0.0016 nM rBoNT/A, 5 nM mBoNT and 0.0016 nM mBoNT treatments before and after red light stimulation (red bar) over the time and quantification of Ca2+ oscillations. Data are represented as mean ± SEM (N = 2 independent experiments, 3 myofibers/well, 3 wells/condition). ANOVA with Sidak’s post hoc tests (****p < 0.0001; *p < 0.05; ns, not significant), each pre-stim recordings were compared to post-stim recordings

