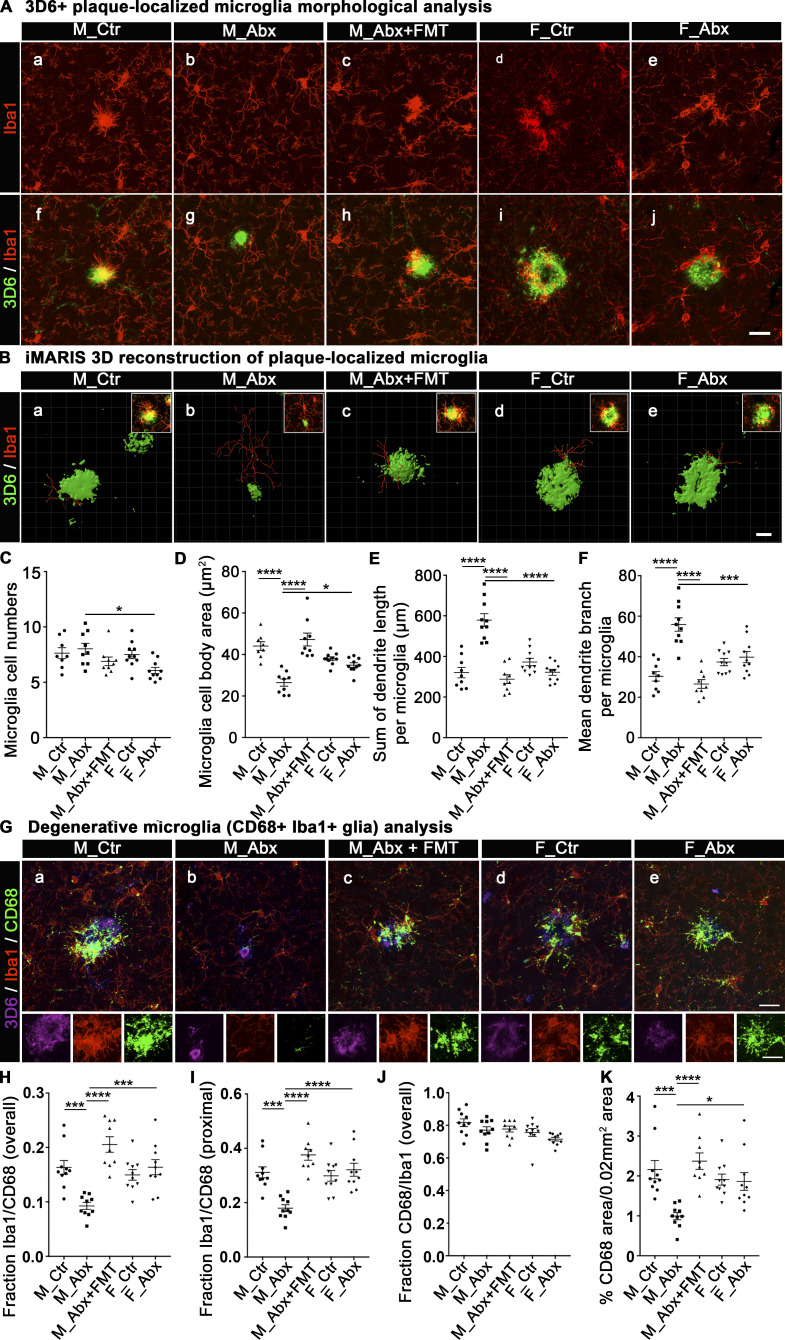
Figure 3.
Short-term ABX alter microglial morphologies and activation status in male mice, and FMT reverts these changes. (A) Representative images of 3D6+ plaque (green)-localized, Iba1+ microglia (red) from M_Ctr, M_Abx, M_ABX+FMT, F_Ctr, and F_Abx groups. (B) Representative images of iMARIS 3D reconstruction and inserts of compressed 3D Z-stacks from M_Ctr, M_Abx, M_Abx+FMT, F_Ctr, and F_Abx. (C) ImageJ quantification of cell numbers showed no differences in plaque-localized microglial cell numbers in M_Abx (P = 0.964) and F_Abx (P = 0.088) compared with their controls. (D) Cell body areas measured using ImageJ showed significantly reduced Iba1+ cell body size in M_Abx compared with M_Ctr (P < 0.0001), which was restored in M_Abx+FMT group that was similar to M_Ctr (P = 0.7926). Female mice showed no significant changes in microglial cell body area (P = 0.755). (E and F) The dendrite branch length (E) and dendrite branch point measures (F) using iMARIS 3D reconstruction showed significantly higher mean branch length and branch points per microglia in M_Abx compared with M_Ctr (P < 0.0001), which was restored in M_Abx+FMT, similar to M_Ctr (P = 0.8717, P = 0.8472). Female mice showed no significant differences in both measures (P = 0.522, P = 0.958). (G) Representative images of 3D6+ plaque (purple)-localized CD68 (lysosome marker: green) reactive Iba1+ microglial cells (red) from M_Ctr, M_Abx, M_Abx+FMT, F_Ctr, and F_Abx in the top panels and cropped inserts of each channel in the bottom panels. (H) The fraction of CD68-reactive microglia was significantly lower in M_Abx compared with M_Ctr (P = 0.0005) and reverted in M_Abx+FMT, similar to M_Ctr (P = 0.11). Female mice showed no significant differences (P = 0.908). (I) Microglia in close proximity to plaques showed significantly lower CD68 reactivity in M_Abx compared with M_Ctr (P = 0.0002) and reverted in M_Abx+FMT, similar to M_Ctr (P = 0.1674). Female mice showed no differences (P = 0.921). (J) Majority (∼80%) of CD68-reactive structures colocalized with Iba1+ cells, and there were no differences among any groups (P > 0.05). (K) Overall CD68 reactivity was significantly diminished in M_Abx compared with M_Ctr (P = 0.0003) and reverted in M_Abx+FMT, similar to M_Ctr (P = 0.93). Female mice showed no differences (P = 0.999). M_Ctr = vehicle-treated male, M_Abx = ABX-treated (PND14–PND21) male, M_Abx+FMT = ABX-treated (PND14–PND21) male, followed by FMT (PND24–PND63) from age-matched Tg-donor male, F_Ctr = vehicle-treated female, and F_Abx = ABX-treated (PND14–PND21) female. n = 8–10 mice per group. Data are mean ± SEM. *, P < 0.05; ***, P < 0.001; ****, P < 0.0001. Scale bars in A, j, B, e, and G, e represent 20 µm, 10 µm, and 20 µm and apply to all panels in A, a–j, B, a–e, and G, a–e, respectively. Detailed statistics are listed in Table S9.

