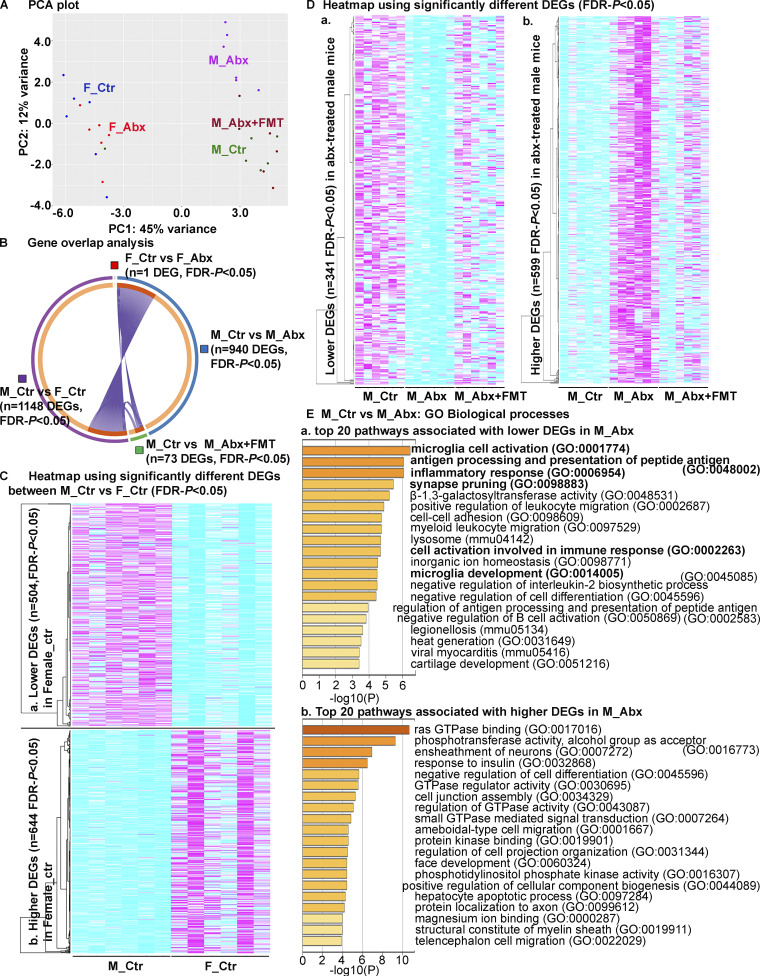
Figure 6.
Short-term ABX results in sex-specific changes of cortical transcriptome profiles. (A) PCA plot of cerebral cortex transcriptomes. n = 6 mice per group. (B) Gene overlap analysis showing number of significantly different genes. Note the numbers of significant DEGs were the highest between sexes (n = 1,148 DEGs: M_Ctr vs. F_Ctr). ABX treatment in male groups showed higher number of DEGs (n = 940, M_Ctr vs. M_Abx) compared with the female groups (n = 1 DEG, F_Ctr vs. F_Abx). Only 73 DEGs were significantly different between M_Ctr vs. M_Abx+FMT, suggesting that FMT restored the transcriptome profiles in M_Abx mice to those of M_Ctr group. (C) Heatmap of DEGs (FDR-P < 0.05) between M_Ctr and F_Ctr with clusters (left). 504 DEGs were significantly lower (a), and 644 DEGs were significantly higher (b) in F_Ctr compared with M_Ctr. Each column is an individual animal, n = 6 mice per group. (D) Heatmap of DEGs (FDR-P < 0.05) between M_Ctr and M_Abx with clusters (left). 341 DEGs were significantly lower (a), and 599 DEGs were significantly higher (b) in M_Abx compared with M_Ctr. Compared with M_Ctr, M_Abx+FMT showed 73 DEGs (55 DEGs were higher, and 21 DEGs were lower) that were significantly different. Each column is an individual animal, n = 6 mice per group. (E) GO biological processes, molecular functions, and KEGG pathways analysis based on the DEGs (FDR-P < 0.05) between M_Ctr and M_Abx groups. Panels show heatmap of top 20 down-regulated pathways (a), while b shows top 20 down-regulated pathways in M_Abx compared with M_Ctr using Metascape. M_Ctr = vehicle-treated male, M_Abx = ABX-treated (PND14–PND21) male, M_Abx+FMT = ABX-treated (PND14–PND21) male, followed by FMT (PND24–PND63) from age-matched Tg-donor male, F_Ctr = vehicle-treated female, and F_Abx = ABX-treated (PND14–PND21) female. GTPase, guanosine triphosphatase.

