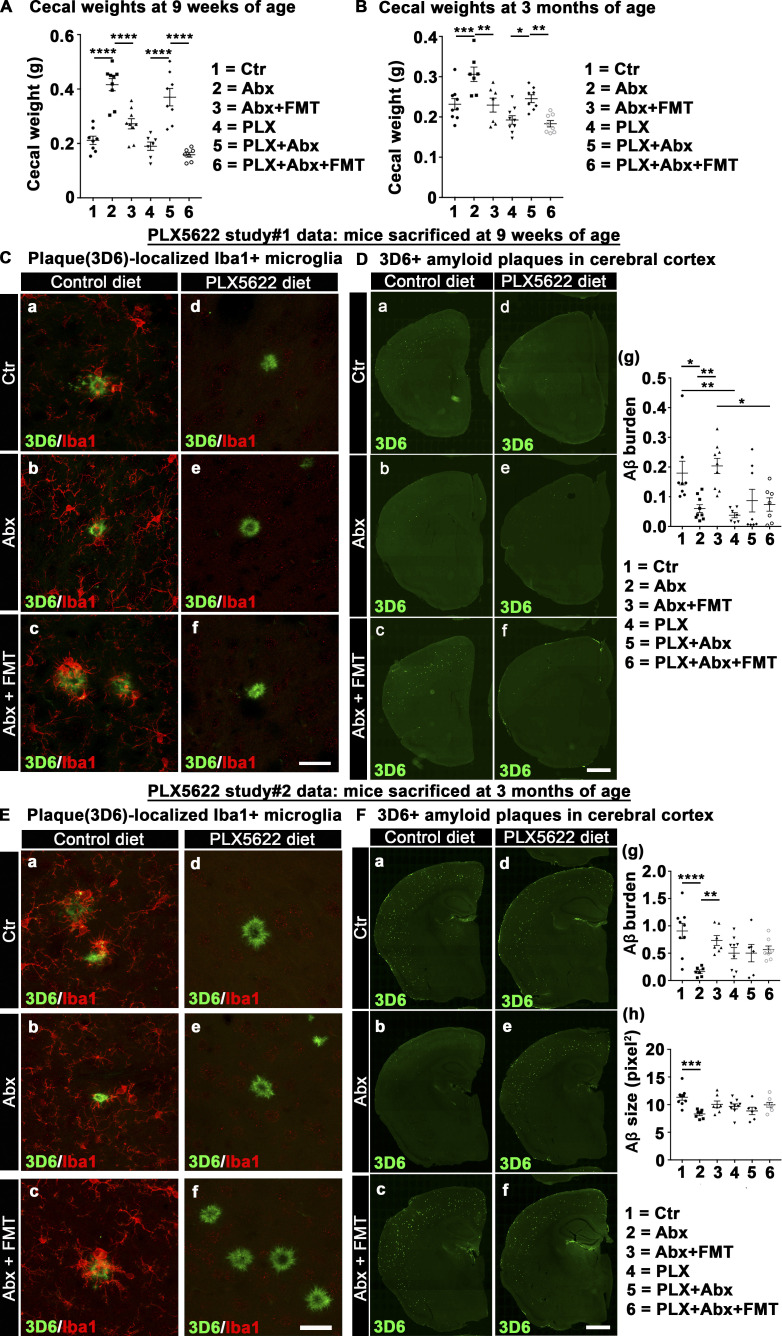
Figure 7.
PLX5622-induced microglia depletion fails to reduce amyloidosis in ABX-treated male mice. (A–F) Male mice were assigned to vehicle (PND14–PND21), ABX (PND14–PND21), or ABX+FMT (ABX [PND14–PND21]+FMT [PND24–until sacrifice]) groups that were subjected to control or PLX5622 diet (PND24–until sacrifice) and sacrificed at 9 wk of age (A, C, and D) or 3 mo of age (B, E, and F). At both 9 wk (A) and 3 mo (B) of age, ABX resulted in cecal enlargement in control and PLX groups, while Abx+FMT showed cecal weights similar to controls. (C) Representative high magnification (a–f) images of 3D6+ plaque (green)-localized Iba1+ microglia (red) from Ctr (a and d), Abx (b and e), and Abx+FMT (c and f) male mice that were assigned to a control (a–c) or PLX5622 (d–f) diet. Note the complete absence of microglia and altered plaque morphology in PLX5622-treated groups (d–f). (D) Representative images of 3D6+ Aβ plaques in Ctr (a and d), Abx (b and e), and Abx+FMT (c and f) groups assigned to a control (a–c) or PLX5622 (d–f) diet. Quantification of Aβ plaque burden using threshold-limited particle analysis of 3D6+ staining is shown in g. ABX treatment resulted in significant reduction of amyloid burden only in control diet–treated mice, and FMT reverted these changes similar to control group. No significant differences in amyloid burden were observed among PLX5622 groups. (E) Representative high-magnification (a–f) images of 3D6+ plaque (green)-localized Iba1+ microglia (red) from Ctr (a and d), Abx (b and e), and Abx+FMT (c and f) male mice that were assigned to a control (a–c) or PLX5622 (d–f) diet. Note the complete absence of microglia and altered plaque morphology in PLX5622-treated groups (d–f). (F) Representative images of 3D6+ Aβ plaques in Ctr (a and d), Abx (b and e), and Abx+FMT (c and f) male mice that were assigned to a control (a–c) or PLX5622 (d–f) diet. Quantification of Aβ plaque burden using threshold-limited particle analysis of 3D6+ staining is shown in g. ABX-treatment showed significant reduction in amyloid burden only in control diet–treated groups, and FMT reverted these changes similar to control group. No differences in amyloid burden were observed among PLX5622 diet–treated groups (P > 0.99). Plaque size quantification (h) showed significant differences within control diet–treated groups. Ctr = vehicle-treated male, Abx = ABX-treated male, Abx+FMT = ABX-treated male with FMT from age-matched Tg donor male mice, PLX = PLX5622 diet–treated vehicle-gavaged mice, PLX+Abx = ABX-treated male mice on PLX5622 diet, PLX+Abx+FMT = ABX-treated male with FMT from age-matched Tg donor male mice on PLX5622 diet. n = 8–10 mice per group. Data are mean ± SEM. *, P < 0.05; **, P < 0.01; ***, P < 0.001; ****, P < 0.0001. Scale bars in C, f and E, f represent 15 µm and apply to C, a–f and E, a–f, while scale bars in D, f and F, f represent 1,000 µm and apply to D, a–f and F, a–f. Detailed statistics are listed in Table S9.

