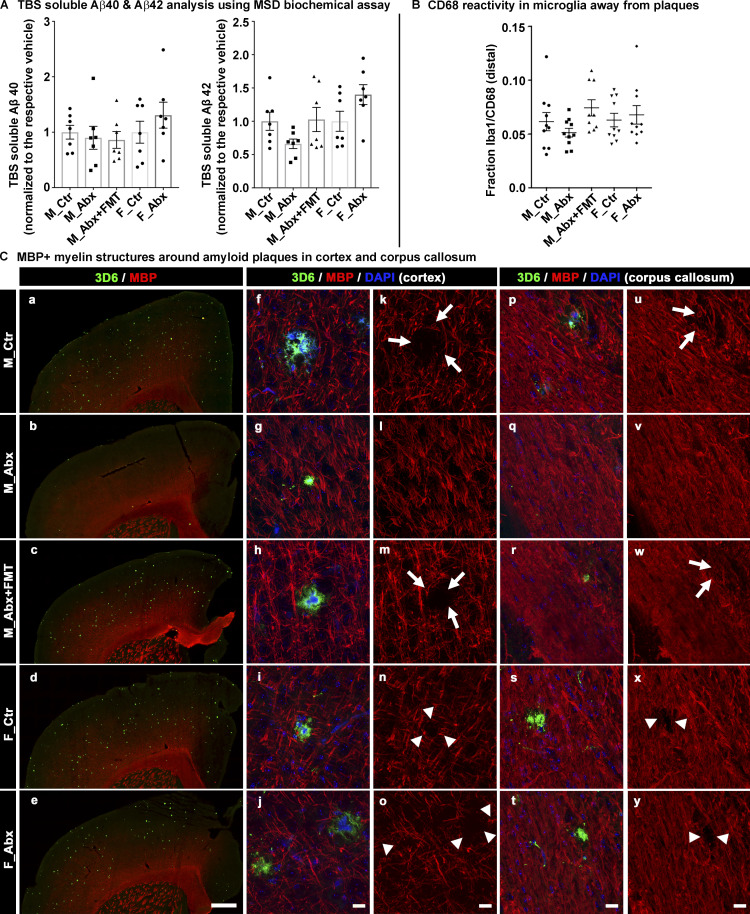
Figure S1.
Soluble Aβ1-40 Aβ1-42 levels measured by MSD biochemical assay, graphical presentation of CD68 reactivity in Iba1 away from plaques using ImageJ, and MBP expression in cerebral cortex and corpus callosum using qualitative comparison. (A) TBS soluble levels of Aβ1-40 and Aβ1-42 in cerebral cortex homogenates are shown using the MSD biochemical assay. n = 6–7 mice per group. (B) Graphical presentation of the colocalization measure of CD68-reactive Iba1+ microglia cells in microglia away from the plaques is shown. n = 8–10 per group. (C) Representative low-magnification (a–e) and high-magnification images (f–y) of 3D6+ plaque (green)-localized, MBP (red) from vehicle-treated male (a, f, k, p, and u), ABX-treated male (b, g, l, q, and v), ABX+FMT–treated male (c, h, m, r, and w), vehicle-treated female (d, i, n, s, and x), and ABX-treated female (e, j, o, t, and y) mice. Higher-magnification images of single-plaque microenvironments were taken from either cerebral cortex (f–o) or corpus callosum (p–y) in a random manner. Note that the arrows in k, m, u, and w indicate loss of MBP in control and ABX+FMT–treated male mice. Arrowheads in n, o, x, and y represent loss of MBP in F_Ctr and F_Abx mice. Note the loss of MBP either by arrows or arrowheads is more prominent in cortex compared with corpus callosum. ABX-treated male mice showed very minimal, if any, loss of MBP-positive structures around Aβ plaques. Scale bar in e represents 500 µm and applies to a–e. Scale bars in j, o, t, and y represent 15 µm and apply to f–y. M_Ctr = vehicle-treated male, M_Abx = ABX-treated male from PND14–PND21 only, M_Abx+FMT = ABX-treated male (PND14–PND21), followed by fecal microbiota transfer (PND24–PND63) from age-matched Tg donor male mice, F_Ctr = vehicle-treated female, and F_Abx = ABX-treated female from PND14–PND21 only. Error bars are mean ± SEM.

