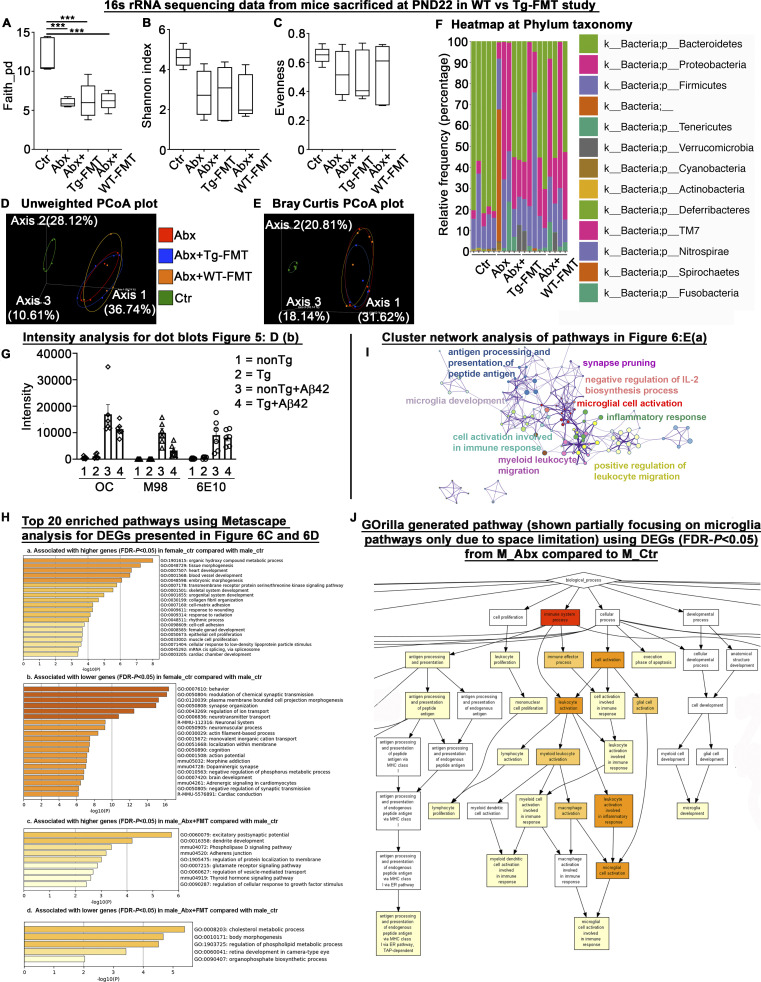
Figure S3.
16S rRNA sequencing analysis of fecal microbiota profile at PND22 in WT- versus Tg-FMT study groups, intensity measurements for dot blots presented in Fig. 5 D, b; cluster network analysis of lower DEGs in M_Abx group presented in Fig. 6 E, a; and RNA-seq data analysis from short-term ABX male and female mice sacrificed at 9 wk of age. The 16s rRNA was employed to confirm the ABX-related fecal microbiota perturbations in ABX-, ABX+WT-FMT, and ABX+Tg-FMT groups compared with the vehicle-treated male group a day after cessation of ABX (PND22). (A) Faith’s diversity showed significant differences among groups (one-way ANOVA: F(3,15) = 13.93, P = 0.0001). Compared with vehicle-treated male mice, ABX-treated mice in ABX, ABX+Tg-FMT, and ABX+WT-FMT groups showed significantly lower diversity (Ctr vs. ABX, Ctr vs. ABX+Tg-FMT, Ctr vs. WT+FMT; P = 0.0006 for each comparison). (B and C) Shannon index (B) and evenness (C) showed no significant differences among groups (P > 0.05). (D) PCoA plot generated using unweighted version of the UniFrac distance metric. The two components explained 36.74% of the variance. ABX treatments resulted in separate clusters compared with Ctr group, and ABX, ABX+Tg-FMT, and ABX+WT-FMT group clusters overlapped with each other at PND22. (E) Bray Curtis PCoA plot showed similar results as unweighted PCoA plot. (F) Relative frequency percentage was plotted at the phylum taxonomy. Ctr = vehicle-treated male, Abx = ABX-treated male, Abx+Tg-FMT = ABX-treated male with FMT from age-matched Tg donor male mice, and Abx+WT-FMT = ABX-treated male with FMT from age-matched non-Tg C57Bl6 donor male mice. n = 4 or 5 mice per group for A–F. Data are mean ± SEM for A–F. ***, P < 0.001. (G) Graphical presentation of intensity measurements for dot blots presented in Fig. 5 D, b. Error bars are mean ± SEM. (H, a) Heatmap associated with higher genes (FDR-P < 0.05) in vehicle-treated female compared with vehicle-treated male mice. (H, b) Heatmap associated with lower genes (FDR-P < 0.05) in vehicle-treated female compared with vehicle-treated male mice. (H, c) Heatmap associated with higher genes (FDR-P < 0.05) in FMT-transplanted ABX-treated male mice compared with vehicle-treated male mice. (H, d) Heatmap associated with lower genes (FDR-P < 0.05) in FMT-transplanted ABX-treated male mice compared with vehicle-treated male mice. (I) cluster network analysis of lower DEG-associated pathways in M_Abx compared with M_Ctr group presented in Fig. 6 E, a. (J) GO biological process analysis using GOrilla. Identified microglial activation as a major impacted pathway similar to topmost GO biological pathways analyzed by Metascape depicting a crucial involvement of microglia in our established model. PCoA, principal coordinate analysis.

