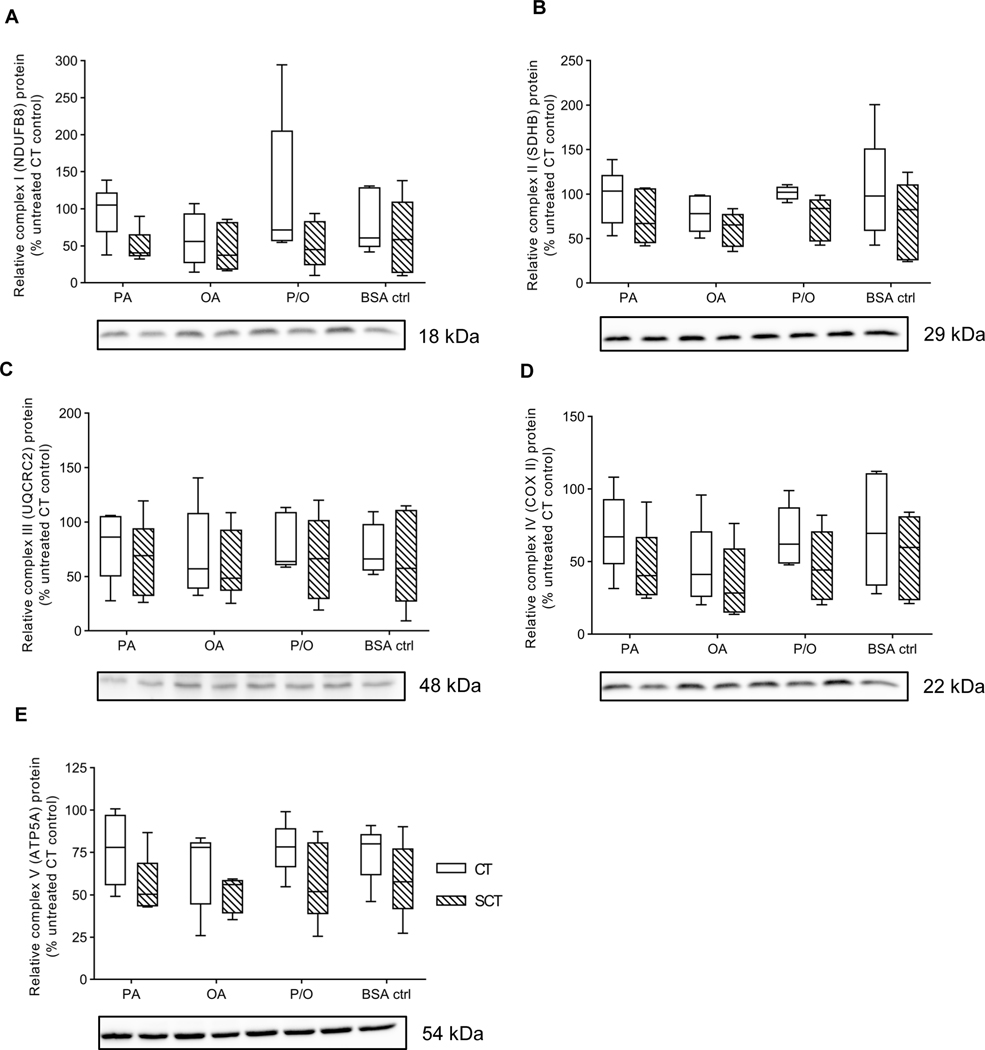
Figure 4. Prolonged NEFA treatment did not affect BeWo Electron Transport Chain complex protein abundance.
Relative protein abundance of (A) Complex I (NDUFB8 subunit) (B) Complex II (SDHB subunit) (C) Complex III (UQCRC2 subunit) (D) Complex IV (COX II subunit), and (E) Complex V (ATP5A subunit) of the Electron Transport Chain was determined at T72H via immunoblotting. Data is presented as percent untreated CT control for each experimental replicate (n=5/group). Representative full length ponceau loading control image is available in Supplementary Figure 3.

