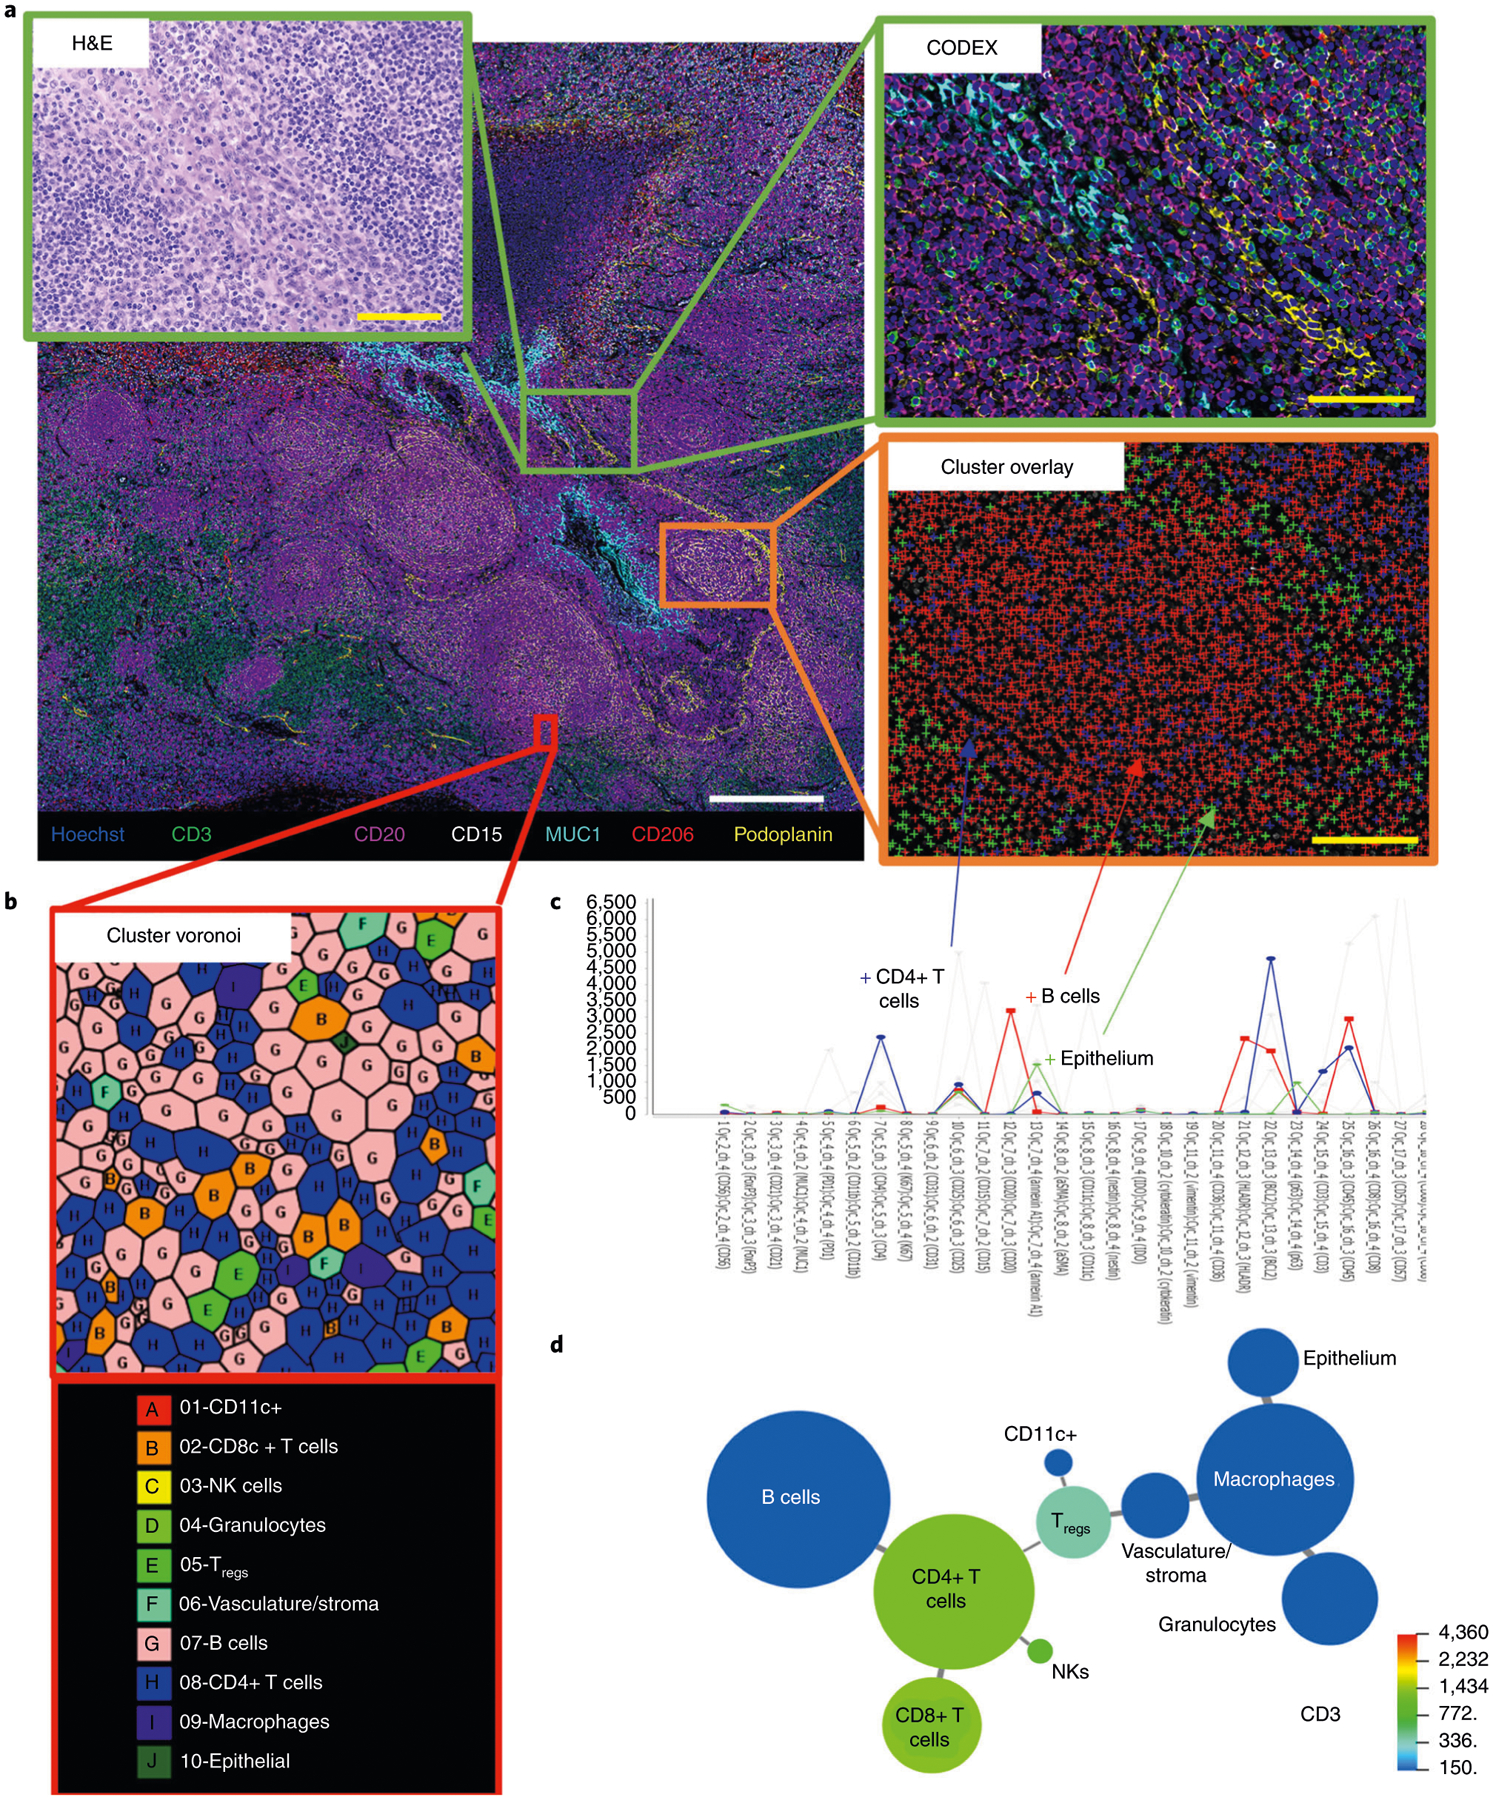
Fig. 12 |. Results from a CODEX multicycle experiment of human FFPE tonsil.

a, Seven-color fluorescent overlay image showing Hoechst, CD3, CD15, CD20, CD206, MUC-1 and podoplanin (colored according to the bottom panel) of a region of 7 × 9 tiles of tonsil; the zoomed-in green boxes show an H&E image and CODEX fluorescent image at higher resolution. b, A zoomed-in Voronoi diagram of the 10 unsupervised clusters obtained from the VorteX interface. c, The average expression profiles of CD4+ T cells, B cells and epithelial cells are shown, and a zoomed-in region (orange box) maps these clusters onto the tissue by using FIJI, with blue crosses representing CD4+ T cells, red crosses representing B cells and green crosses representing epithelial cells (gray bars in the clustering interface show other cluster profiles not highlighted here). The y axis of the graph represents the average fluorescent intensity of the cells within each cluster; the graph was cropped to zoom in on a subset of markers used in CODEX. d, A minimal spanning tree of the 10 identified clusters, with the size of each circle corresponding to the relative size of the cluster across the tissue and the color representing the average expression of CD3 in quantile scale. Written informed consent was obtained from all patients. All samples were fully de-identified, and the study was exempt from ethics approval (no human subjects research). Yellow scale bars, 100 μm. White scale bar, 500 μm. NK, natural killer; Tregs, regulatory CD4+ T cells.
