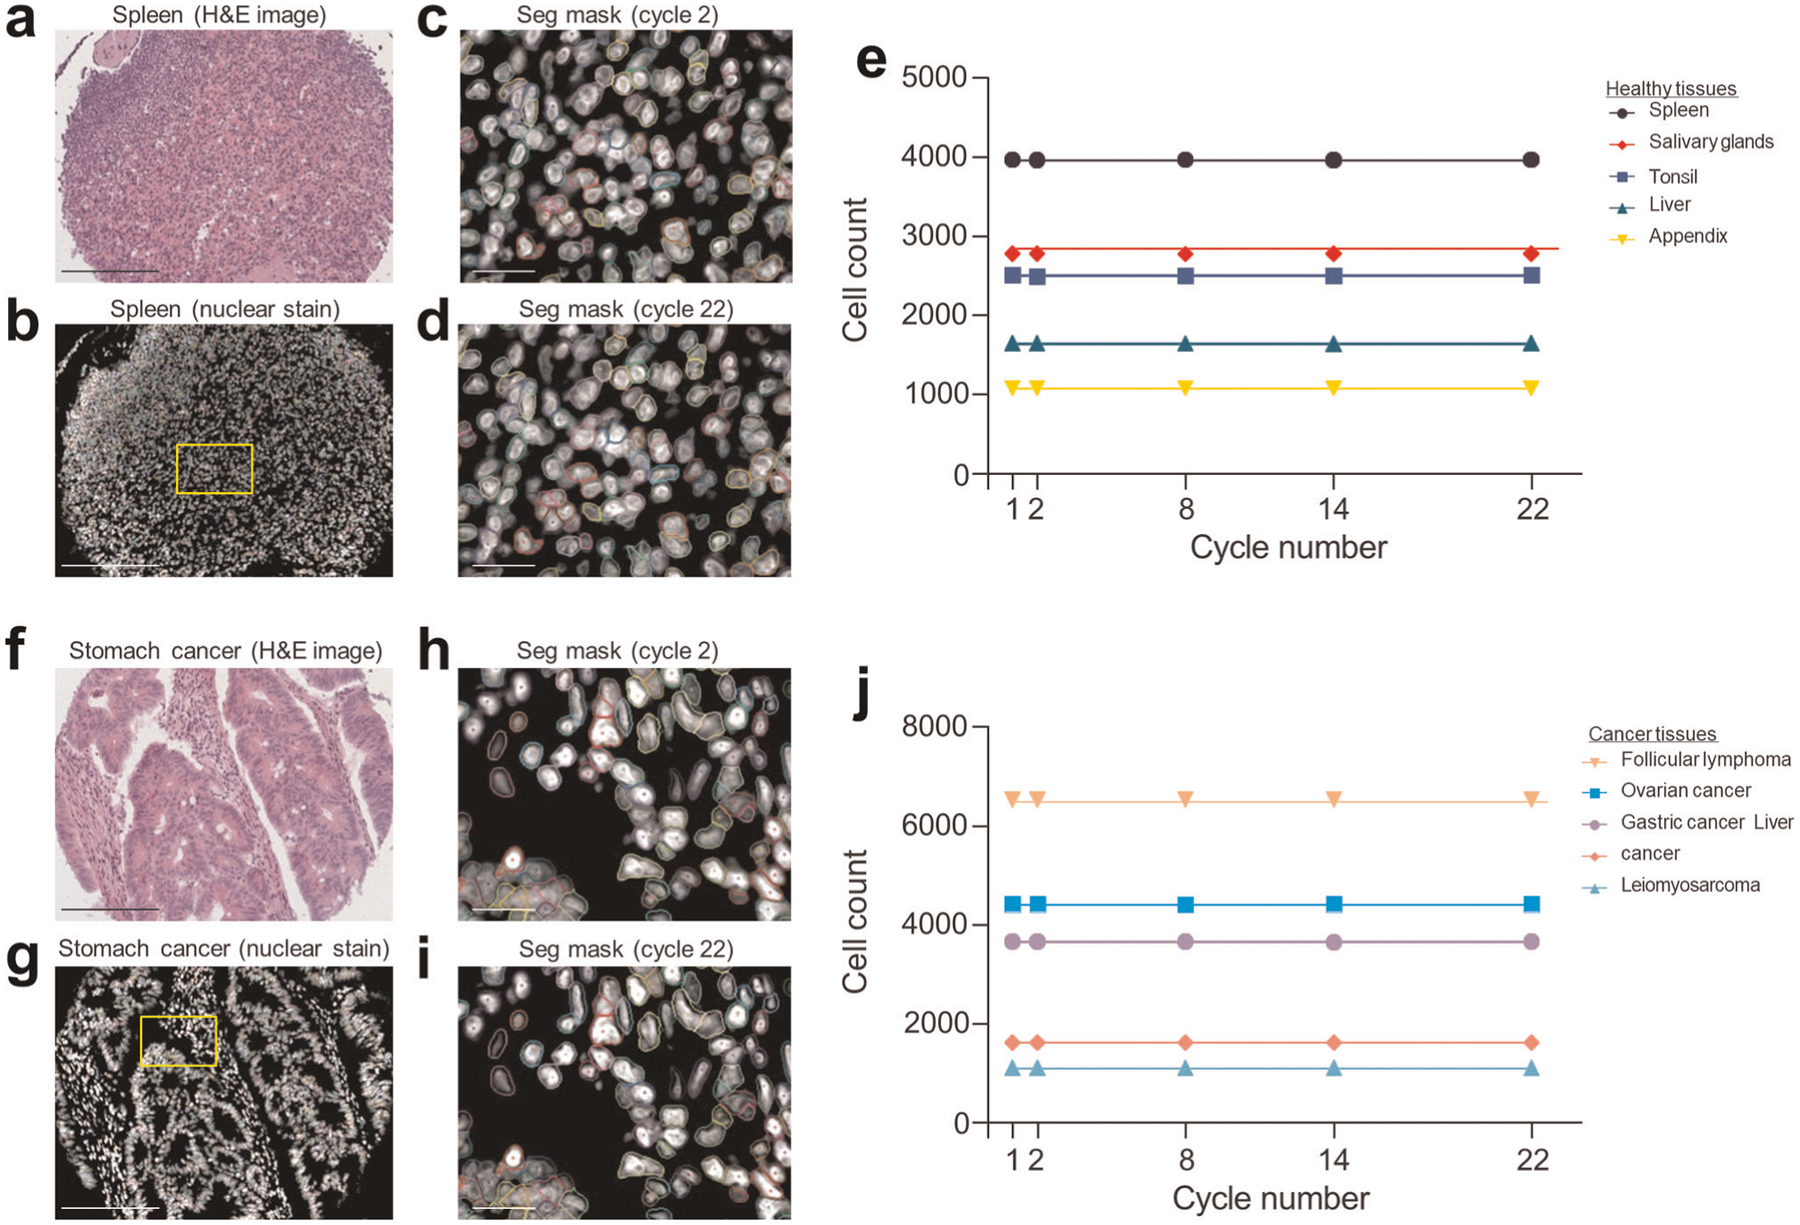
Extended Data Fig. 2 |. Analysis of healthy and cancerous tissue morphology during multicycle imaging.

a, H&E image of a healthy spleen. Scale bar, 200 μm. b, Corresponding nuclear (Hoechst) stained image and cellular segmentation (Seg) mask. Scale bar, 200 μm. c, Zoomed-in nuclear stained image and cellular segmentation mask from cycle 2. Scale bar, 20 μm (Extended Data Applied Sciences 28 April 2020). d, Zoomed-in nuclear stained image and cellular segmentation mask from cycle 22. Scale bar, 200 μm. e, Line plot of total cell count per tissue microarray core, measured at cycles 1, 2, 8, 14 and 22, for five healthy tissues. Lines are colored according to the corresponding legend. f, H&E image of stomach cancer. Scale bar, 200 μm. g, Corresponding nuclear (Hoechst) stained image and cellular segmentation mask. Scale bar, 200 μm. h, Zoomed-in nuclear stained image and cellular segmentation mask from cycle 2. Scale bar, 20 μm. i, Zoomed-in nuclear stained image and cellular segmentation mask from cycle 22. Scale bar, 200 μm. j, Line plot of total cell count per tissue microarray core, measured at cycles 1, 2, 8, 14 and 22, for five cancer tissues. Lines are colored according to the corresponding legend.
