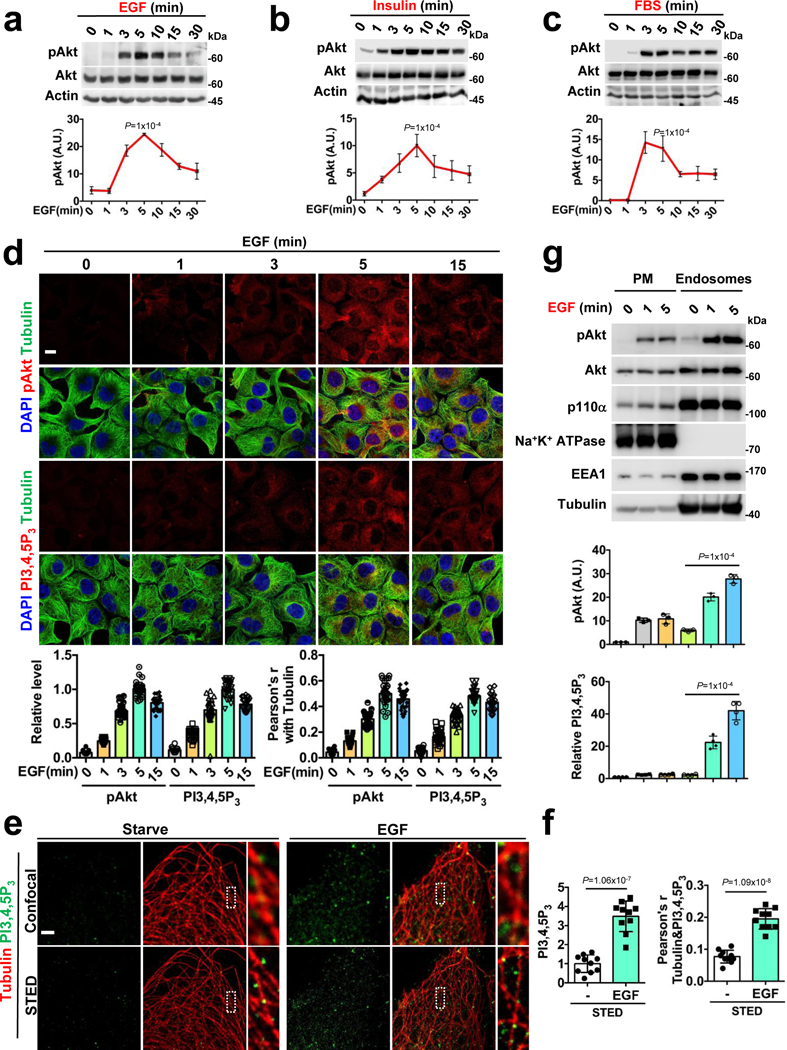
FIGURE 1: Agonist-stimulated Akt Activation and PI3,4,5P3 Generation at Internal Membranes.
a, b, c, Activation of Akt upon agonist stimulation. The activation of Akt in MDA-MB-231 cells at different time points following EGF or insulin or FBS stimulation were examined by immunoblotting using phospho-Akt antibody. Error bars denote mean±SD; n=4 independent experiments
d, Spatial localization of activated Akt and PI3,4,5P3 upon EGF stimulation. MDA-MB-231 cells were fixed at different time points following EGF stimulation. Localization of activated Akt and PI3,4,5P3 along microtubules was examined by immunostaining with antibodies specific to phospho-Akt and PI3,4,5P3 respectively. The immunofluorescence signals of activated Akt and PI3,4,5P3 at different time points were quantified. Similarly, the co-localization of activated Akt and PI3,4,5P3 with tubulin were quantified by Pearson’s r. Scale bar, 5 μm; Error bars denote mean±SD; n=30 cells from representative experiments
e, f Super-resolution microscopy revealing spatial localization of PI3,4,5P3. MDA-MB-231 cells upon EGF stimulation were immuno-stained for PI3,4,5P3 and tubulin and processed by STED microscopy. PI3,4,5P3 signal was quantified in control vs. EGF stimulated cells. The relative level of PI3,4,5P3 signal and co-localization with tubulin quantified. Scale bar, 1 μm; Error bars denote mean±SD; n=10 cells from representative experiments.
g, Quantification of activated Akt and PI3,4,5P3 in plasma membrane and endosomes. MDA-MB-231 cells after EGF stimulation were harvested for subcellular fractionation. The activated Akt and PI3,4,5P3 were quantified in the plasma membrane and endosomal fractions by immunoblotting and ELISA, respectively, as described in “Methods”. Error bars denote mean±SD; n=3 independent experiments
Unprocessed_Western_Blots_Fig1; Statistical_Source_Data_Fig1

