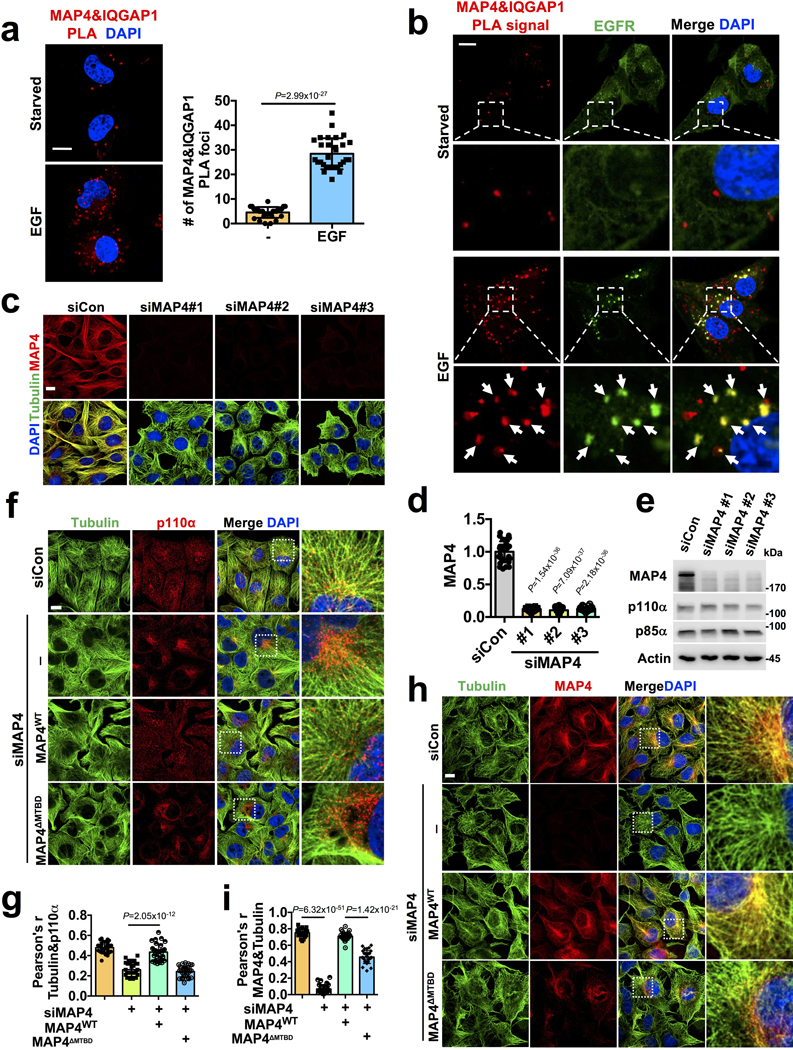
Extended Data Fig. 6. Co-localization of MAP4/IQGAP1 with EGFR, Effect of MAP4 Knockdown in Distribution of PI3Kα Vesicles along Microtubules in cells expressing WT MAP4 and MTBD Deletion Mutant.
a, b, PLA shows induced association of MAP4 and IQGAP1 and that they are localized with EGFR. MDA-MB-231 cells were stimulated with EGF and processed for MAP4-IQGAP1 PLA followed by immunostaining with EGFR. The image shown is the representative images of multiple reproducible experiments. Scale bar, 5 μm; Error bars denote mean±SD; n=30 cells from representative experiments </p/>c, d, e, MAP4 knockdown demonstrated by immunofluorescence study and immunoblotting. Three different siRNAs were used individually to knockdown MAP4 in MDA-MB-231 cells. 48–72 hours after siRNA transfection, cells were processed for immunofluorescence study using an antibody specific to MAP4 and tubulin. MAP4 knockdown was also shown by immunoblotting. The image and blot shown is the representative of reproducible experiments. Scale bar, 5 μm; Error bars denote mean±SD; n=30 cells from representative experiments </p/>f, g, Localization of PI3Kα vesicles along microtubules in WT and MTBD deletion mutant of MAP4 expressing cells after knocking down endogenous MAP4. As described above, siRNAs targeting 3’ UTR region of MAP4 were used to knockdown endogenous MAP4. Cells were processed for immunofluorescence study using antibodies specific for p110α and tubulin. Distribution of PI3Kα vesicles along microtubules was quantified. n=30 cells from representative experiments
h, i, Localization of ectopically expressed WT and MTBD deletion mutant of MAP4 after knockdown of endogenous MAP4. The siRNAs targeting the 3’ UTR region of MAP4 (siMAP4#3) were used to knockdown endogenous MAP4 in MDA-MB-231 cells expressing MAP4 WT or MTBD deletion mutant of MAP4. 48–72 hours post-transfection, cells were examined via immunofluorescence study using antibodies specific to MAP4 and tubulin. The colocalization of ectopically expressed MAP4 with tubulin was quantified by Pearson’s r. Scale bar, 5 μm; Error bars denote mean±SD; n=30 cells from representative experiments Unprocessed_Western_Blots_Extended_Data_Fig6; Statistical_Source_Data_Extended_Data_Fig6

