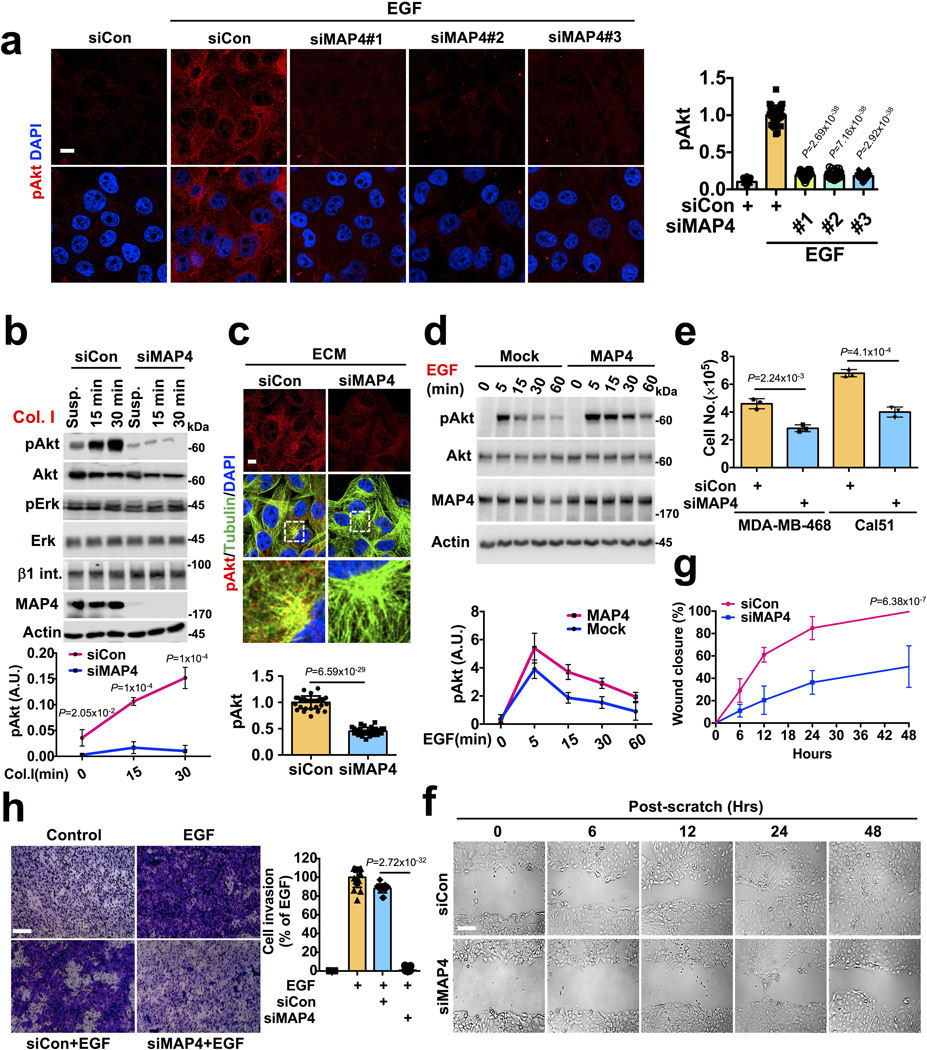
Extended Data Fig. 8. Effect of MAP4 Knockdown in Akt activation, Cell Proliferation, and Cell Invasion.
a, MAP4 loss impairs activation of Akt downstream of EGFR. Three different siRNAs were used individually to knockdown MAP4 in MDA-MB-231 cells. EGF induced Akt activation was analyzed by immunofluorescence microscopy. Scale bar, 5 μm; Error bars denote mean±SD; n=30 cells from representative experiments. </p/>b, c, MAP4 loss impairs Akt activation downstream of integrin receptors. MDA-MB-231 cells were detached from culture plates 72-hours post-siRNA transfection for MAP4 knockdown (siMAP4#1) and resuspended in serum-free medium. Cells were seeded into culture plates-coated with type I collagen before harvesting at different time points followed by immunoblotting or immunofluorescence microscopy using an antibody specific for activated Akt and tubulin. Scale bar: 5 μm. Error bars denote mean±SD; n=4 independent experiments (b), n=30 cells from representative experiments (c) </p/>d, MAP4 overexpression promotes Akt signaling. MDA-MB-231 cells ectopically overexpressing MAP4 or Mock were serumstarved overnight before stimulating with EGF. Cells were harvested at different time points and activation levels of Akt were examined by immunoblotting using activated Akt specific antibody. Error bars denote mean±SD; n=3 independent experiments </p/>e, Effect of MAP4 knockdown in cell proliferation. MDA-MB- 468 and Cal51, both showing higher activation levels of Akt were transfected with siRNA for MAP4 knockdown. 72–96 hours postsiRNA transfection, cell numbers were manually quantified. Scale bar, 100 μm; Error bars denote mean±SD; n=3 independent experiments </p/>f. g, h, Effect of MAP4 knockdown in cell invasion and cell migration. 48–72 hours post-siRNA transfection for MAP4 knockdown, cell invasion and scratch-wound healing for cell migration were performed. The image shown is the representative images of multiple reproducible experiments. Scale bar, 100 μm; Error bars denote mean±SD; n=9 fields from representative experiments (g), n=15 fields from representative experiments (h) Unprocessed_Western_Blots_Extended_Data_Fig8; Statistical_Source_Data_Extended_Data_Fig8

