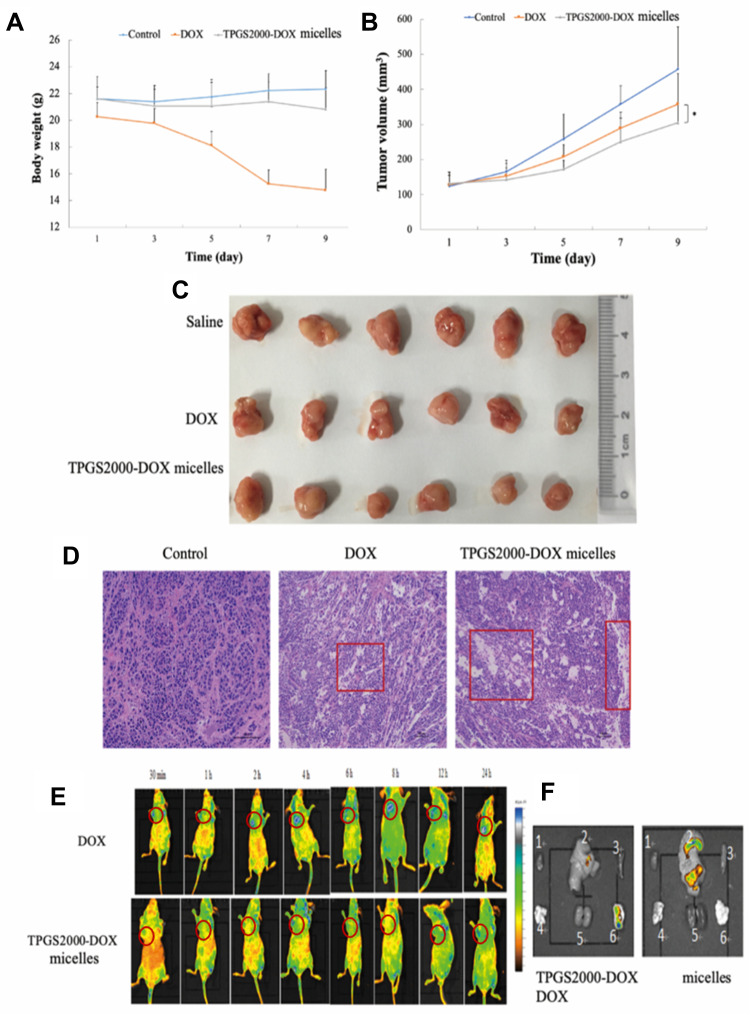
Figure 7.
The body weight (A) and the tumor volume (B) change of the mice treated with Saline, free DOX and TPGS2000 -DOX micelles over time (*P < 0.05). (C) Photographs of excised tumor weight at the end of the experiment. (D) Images of H&E-stained sections of the tumor collected from mice in the different treatment groups with 100-micron scale rod. (E) In vivo fluorescence image of nude mice after administration of TPGS2000-DOX micelles at 30min, 1h, 2 h, 4 h, 6h, 8 h, 12h and 24 h. (F) Ex vivo DOX fluorescence images of isolated different organs (1- heart, 2-liver, 3-spleen, 4-lung, 5-kidney and 6-tumor).

