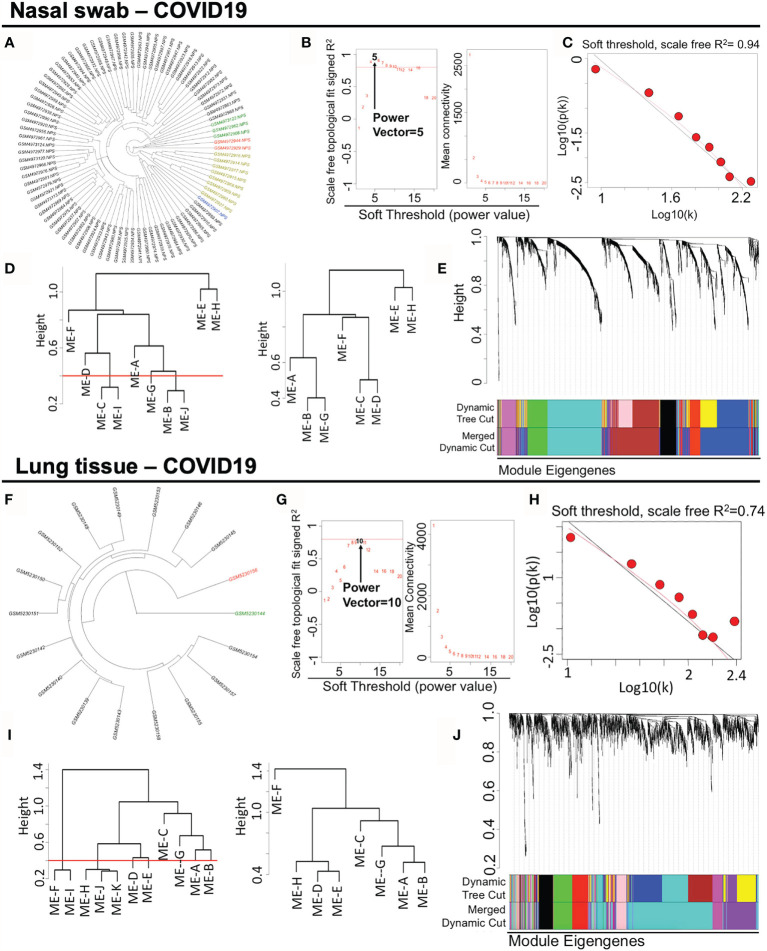
Figure 2.
Constructing weighted co-expression gene modules from nasopharyngeal specimen and pulmonary tissue in COVID-19. (A, F) Hierarchical clustering of genes in nasal swab and lung tissue. The coloring samples are the outliers due to the numerous missing or zero-variance expression genes. (B, G) Analysis of network topology for various soft-thresholding powers. Left panel shows the index of scale-free topology fit (y-axis) as a function of the soft-thresholding power (x-axis). Right panel shows the value of mean connectivity (y-axis) as a function of soft-thresholding power (x-axis). (C, H) A log-log plot of connectivity of signed adjacency matrices. The x-axis stands for the logarithm of entire network connectivity, while y-axis is logarithm of related frequency distribution (D, I) Hierarchical clustering and merging of close-distance gene patterns. (E, J) A dendrogram composed of relationships among clustered gene modules with high adjacency.

