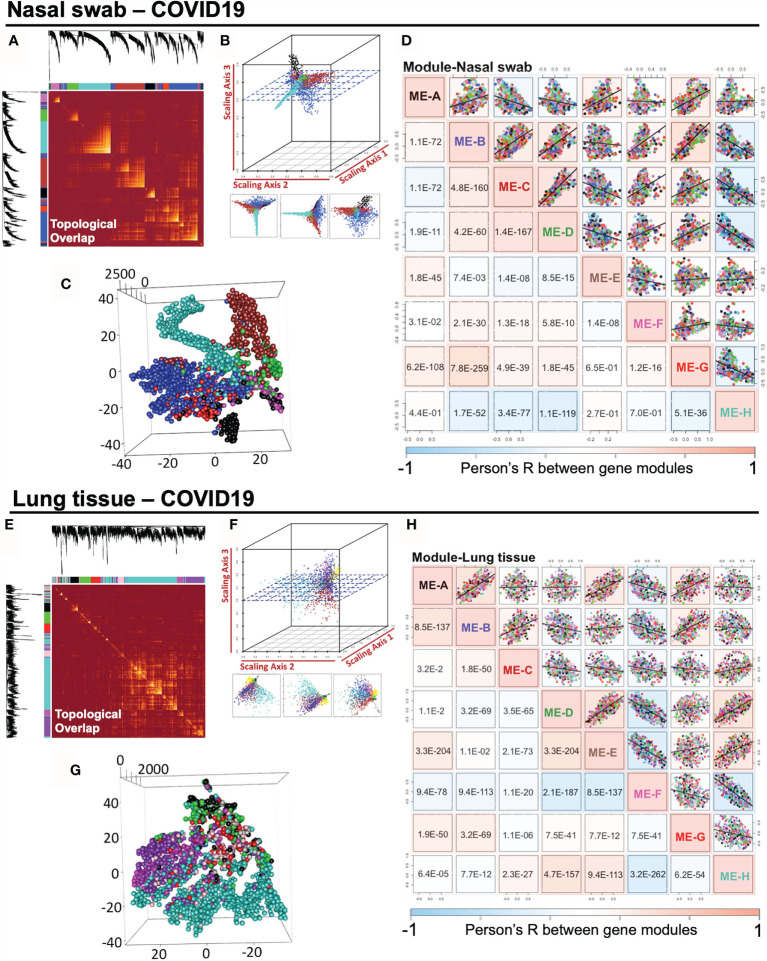
Figure 3.
Impact of SARS-CoV-2 infection on the intramodular correlation of co-expression gene modules in nasal swabs and lung tissues. (A, E) A pairwise association of gene modules in a topological overlap plot. (B, F) Geometric data analysis in 3D scattering. (C, G) t-SNE dimension reduction analysis to observe the distribution of gene modules. (D, H) Pairwise illustration of gene module correlation profile indicated by Pearson’s R shown in whole pairwise scatterplots in color with p-value in the lower panel (one-way ANOVA with Tukey’s multiple comparison).

