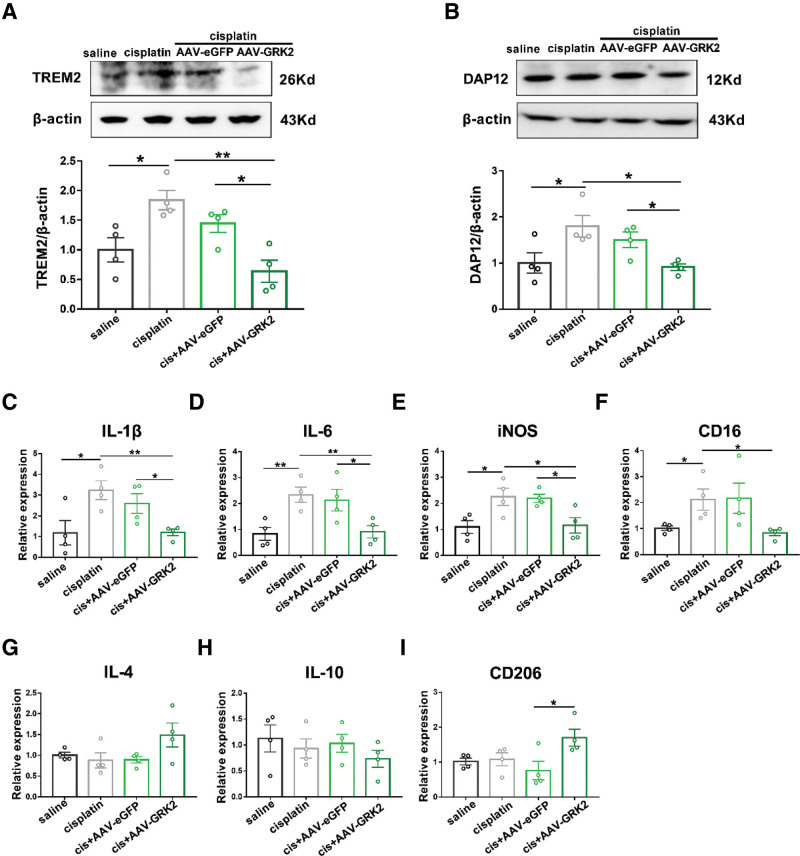
Figure 2.
Upregulation of neuronal GRK2 altered the proinflammatory activity of spinal microglia and the expression of TREM2/DAP12. Western blot analysis of TREM2 (A) and DAP12 (B) on week 3 after the first cisplatin injection. Results are normalized to β-actin and shown as ratios to saline-treated mice. Values are mean ± SEM. *P < .05, **P < .01. A, Saline versus cisplatin P = .0149; cis + AAV-eGFP versus cis + AAV-GRK2 P = .0187; cisplatin versus cis + AAV-GRK2 P = .0012. B, saline versus cisplatin P = .0482; cis + AAV-eGFP versus cis + AAV-GRK2 P = .0168; cisplatin versus cis + AAV-GRK2 P = .0107. Real-time PCR analysis of pain-related molecules at week 3 after the first cisplatin injection. These molecules were included: IL-1β (C), IL-6 (D), iNOS (E), CD16 (F), IL-4 (G), IL-10 (H), and CD206 (I). Results are normalized to GAPDH. Values are mean ± SEM. *P < .05, **P < .01. C, Saline versus cisplatin P = .0321; cis + AAV-eGFP versus cis + AAV-GRK2 P = .0333; cisplatin versus cis + AAV-GRK2 P = .0054. D, Saline versus cisplatin P = .0078; cis + AAV-eGFP versus cis + AAV-GRK2 P = .0440; cisplatin versus cis + AAV-GRK2 P = .0092. E, Saline versus cisplatin P = .0293; cis + AAV-eGFP versus cis + AAV-GRK2 P = .0218; cisplatin versus cis + AAV-GRK2 P = .0485. F, Saline versus cisplatin P = .0395; cisplatin versus cis + AAV-GRK2 P = .0240. I, Cis + AAV-eGFP versus cis + AAV-GRK2 P = .0392. AAV indicates adeno-associated virus; CD, cluster of differentiation; DAP12, DNAX-activating protein of 12 kDa; eGFP, enhanced green fluorescent protein; GAPDH, glyceraldehyde-3-phosphate dehydrogenase; GRK2, G protein–coupled receptor kinase 2; IL, interleukin; iNOS, inducible nitric oxide synthase; PCR, polymerase chain reaction; SEM, standard error of the mean; TREM2, triggering receptor expressed on myeloid cells 2.

