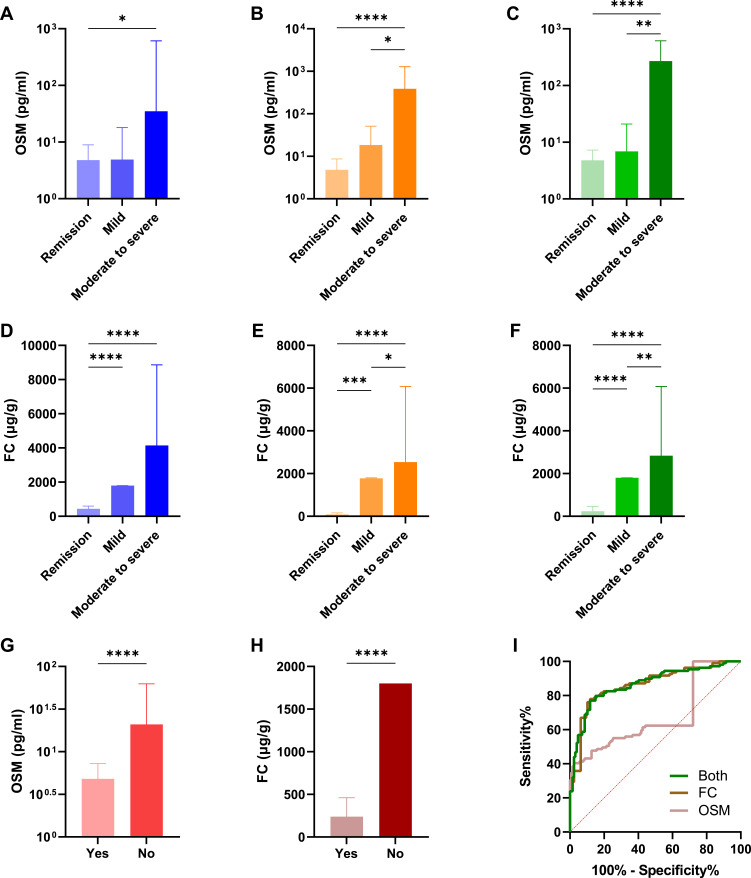
Figure 2.
Correlations of fecal OSM and FC with clinical activity. The expression of fecal OSM in CD (A), UC (B), and combined CD and UC patients (C) classified by HBI or pMS. The expression of FC in CD (D), UC (E), and combined CD and UC patients (F) classified by HBI or pMS. The expression of fecal OSM (G) and FC (H) in IBD patients with and without clinical remission. (I) ROC curves of two fecal biomarkers to identify clinical remission. *P < 0.05, **P < 0.01, ***P < 0.001, ****P < 0.0001.

