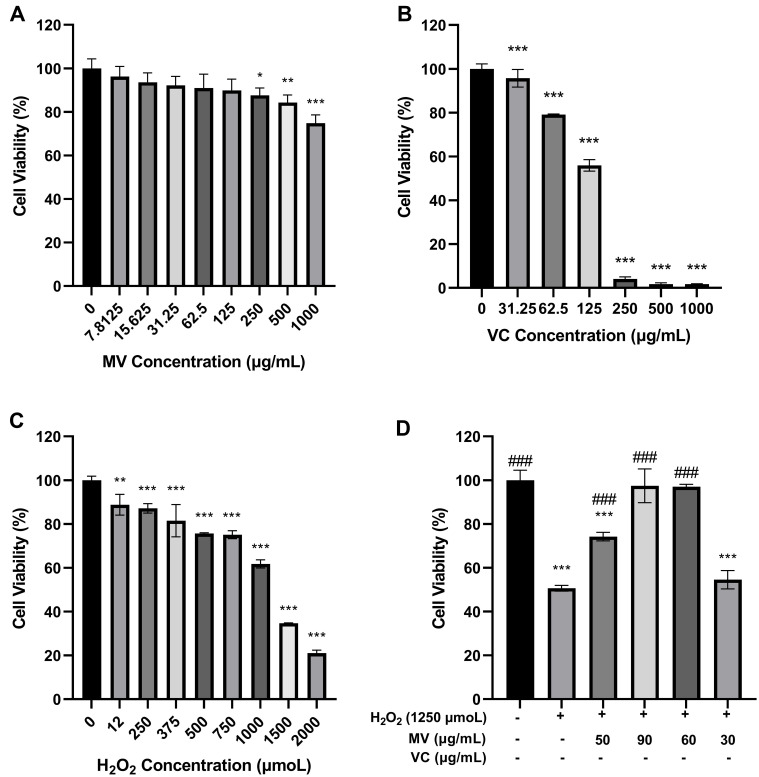
Figure 1.
(A) Effects of different concentrations of MV on cell viability (n=6); (B) Effects of different concentrations of VC on cell viability (n=6); (C) Effects of different concentrations of H2O2 on cell viability (n=6); (D) Cell viability was measured by CCK8 after 24 h of MV or VC pretreatment and 2 h of H2O2 stimulation.
Notes: ANOVA test was performed to determine statistical significance. Compared with the blank group, *P < 0.033, **P < 0.002, ***P < 0.001. Compared with the damage model group, ###P < 0.001. When P > 0.033, values do not have a common mark (*, #).
Abbreviations: MV, mogroside V; VC, vitamin C; H2O2, hydrogen peroxide.

