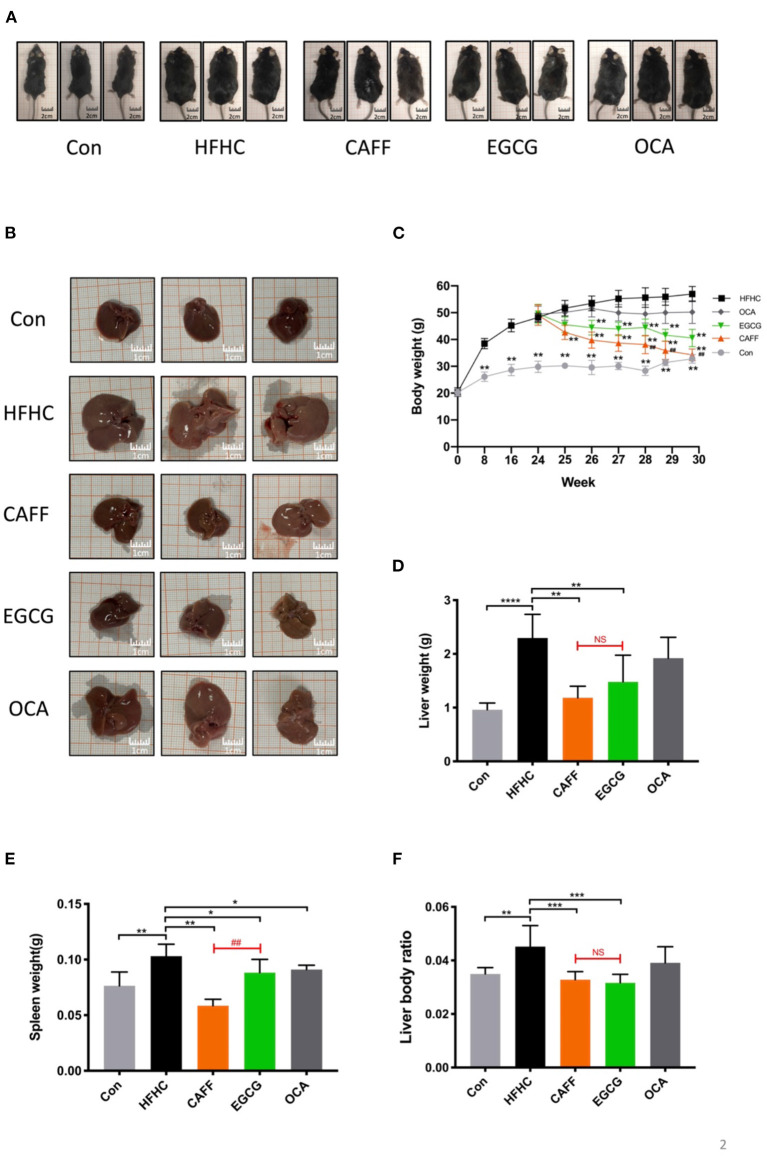
Figure 2.
The general condition of mice in each group. (A) Representative pictures of mice morphology in each group at sacrifice. (B) Representative pictures of liver morphology in each group at sacrifice. Changes in body weight (C), liver weight (D), spleen weight (E) and liver body ratio (F) of the mice in each group (n = 8) vs. HFHC, *P < 0.05, **P < 0.01, ***P < 0.001, ****P < 0.0001; vs. EGCG, ##P < 0.01, NS, not significant.

