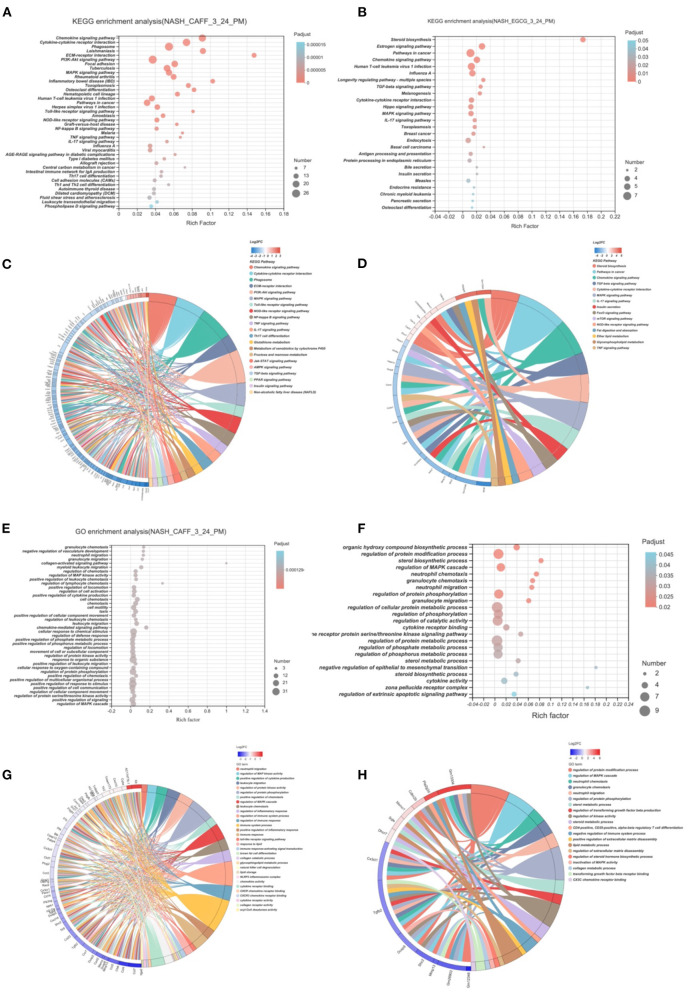
Figure 7.
Functional Enrichment Analysis of Caffeine and EGCG Gene Sets. Bubble graph of KEGG enrichment analysis of different genes of caffeine (A) and EGCG (B) compared with HFHC. KEGG enrichment analysis of caffeine (C) and EGCG (D) differential genes and enrichment circos graph of NASH related pathways. Bubble graph of GO enrichment analysis of different genes of caffeine (E) and EGCG (F) compared with HFHC. KEGG enrichment analysis of caffeine (G) and EGCG (H) differential genes and enrichment circos graph of NASH related pathways.

