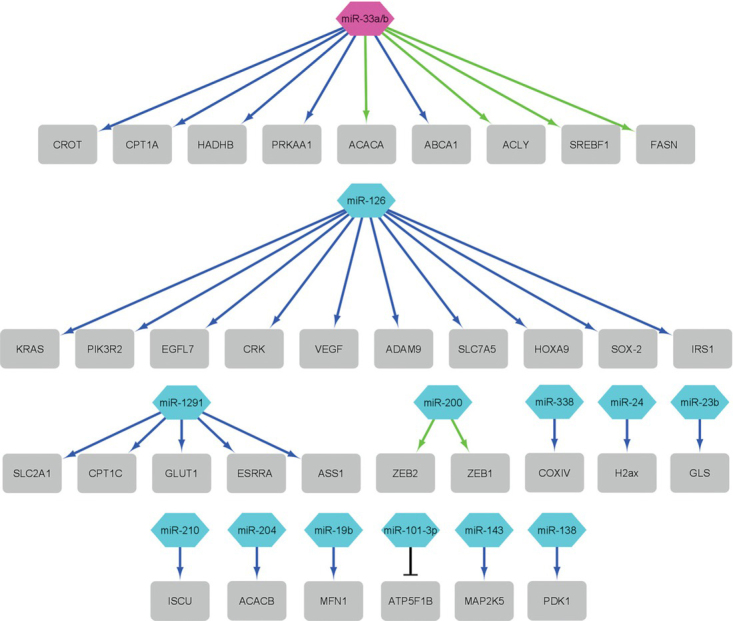
Figure 2.

The network of the mitomiRs and their target genes (grey rectangle) in primates (data from Table 1). Blue arrows present downregulation, green arrows present upregulation and black T-line present silencing. Purple octagon shape presents monkey miRNA and cyan hexagon presents human miRNAs (figure constructed with Cytoscape Network Data Integration, Analysis, and Visualization in a Box V3.8.2).
