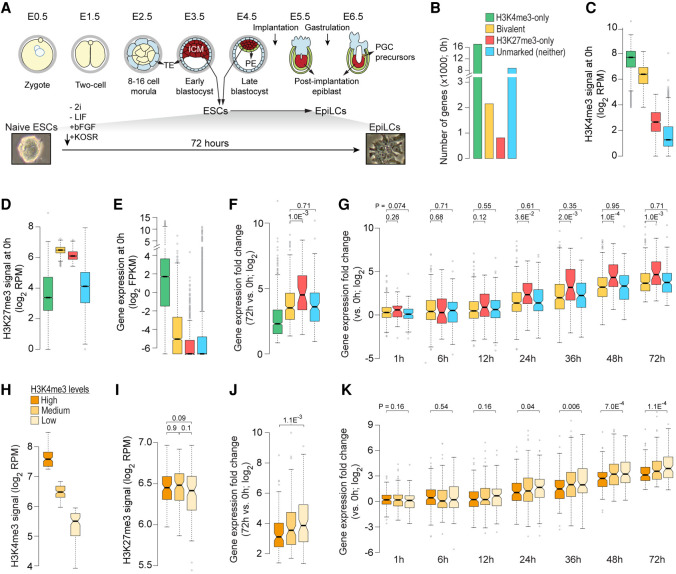
Figure 2.
Bivalent chromatin does not poise genes for rapid activation. (A, top) Developmental events during early embryogenesis in mouse embryo. (Bottom) Schematic showing in vitro differentiation of naive ESCs to EpiLCs. (ICM) inner cell mass; (ESCs) embryonic stem cells; (TE) trophectoderm; (PE) primitive endoderm; (EpiLC) post-implantation epiblast-like cells; (PGCs) primordial stem cells. (B) Number of genes within each of the four classes, defined based on H3K4me3 (±500 bp of TSS) and/or H3K27me3 (±2 kb of TSS) enrichment at gene promoters in naive ESCs (0 h) (Yang et al. 2019). (Bivalent) Positive for H3K4me3 and H3K27me3; (H3K4me3-only) positive for H3K4me3 and negative for H3K27me3; (H3K27me3-only) positive for H3K27me3 and negative for H3K4me3; (Unmarked) negative for both H3K4me3 and H3K27me3. (C–E) Box plots showing the distribution of ChIP-seq read densities for H3K4me3 (C) and H3K27me3 (D) at gene promoters and gene expression (E) in naive ESCs for each of the four gene classes defined in B. (RPM) Reads per million mapped reads; (FPKM) fragments per kilobase per million mapped reads. (F) Box plot showing the distribution of gene expression fold changes for genes up-regulated in EpiLCs (72 h vs. 0 h; n = 1372) (Yang et al. 2019). Genes grouped based on their chromatin states in naive ESCs (0 h). (G) Box plot showing the distribution of gene expression fold changes over time (vs. 0 h) for genes up-regulated in EpiLCs (Yang et al. 2019). Genes grouped based on their chromatin states in naive ESCs (0 h). (H,I) Bivalent genes up-regulated in EpiLCs (72 h vs. 0 h; n = 1372) were binned into three equal-sized sets based on H3K4me3 enrichment at gene promoters in naive ESCs (0 h). Box plots showing the distribution of ChIP-seq read densities for H3K4me3 (H) and H3K27me3 (I) in naive ESCs for each of the three defined sets. (J) Box plot showing the distribution of gene expression fold changes (72 h vs. 0 h) for bivalent genes up-regulated in EpiLCs. Genes grouped based the three sets defined in H. (K) Box plot showing the distribution of gene expression fold changes over time (72 h to 0 h) for bivalent genes up-regulated in EpiLCs (72 h vs. 0 h). Genes grouped based on high/low H3K4me3 signal, as defined in H. All the P-values were calculated using two-sided Wilcoxon rank-sum test. See also Supplemental Figures S2–S4.

