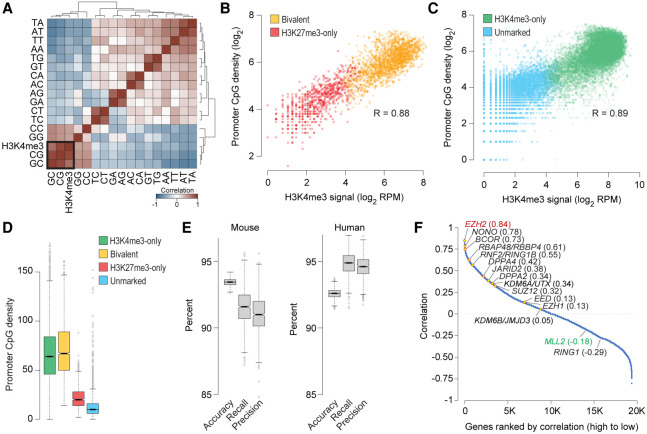
Figure 4.
Bivalent chromatin is a product of PRC2 activity at CpG-rich sequences. (A) Heatmap showing unsupervised hierarchical clustering of pairwise Pearson's correlations between H3K4me3 levels and dinucleotide frequency (5′ to 3′) at the promoters (±500 bp of TSS) of genes enriched for H3K27me3 in naive mouse ESCs. (B,C) Scatter plot showing correlation between CpG dinucleotide frequency and H3K4me3 read density at promoters (±500 bp of TSS) of genes with (B) or without (C) H3K27me3 enrichment in naive mouse ESCs. (D) Box plots showing the distribution of CpG dinucleotide frequency at promoters (±500 bp of TSS) of genes within each the four classes defined in Figure 2B. (E) Statistics summarizing the performance of the multinomial logistic regression-based machine learning method for predicting chromatin state of mouse or human gene promoters (Bivalent, H3K27me3-only, H3K4me3-only, or unmarked) using only H3K27me3 data and dinucleotide frequencies at gene promoters. Box plots show the distribution of indicated performance measures over 1000 models. (Accuracy) fraction of predictions that are correct; (Recall [sensitivity]) fraction of bivalent genes correctly predicted as such; (Precision [positive predictive value]) fraction of predicted bivalent genes that are correct. (F) Plot showing Pearson's correlation between number of bivalent genes and expression of individual genes, calculated based on data from various cell types. Genes, denoted as individual data points, are sorted (left to right, x-axis) based on their correlation values (y-axis). See also Supplemental Figure S7.

