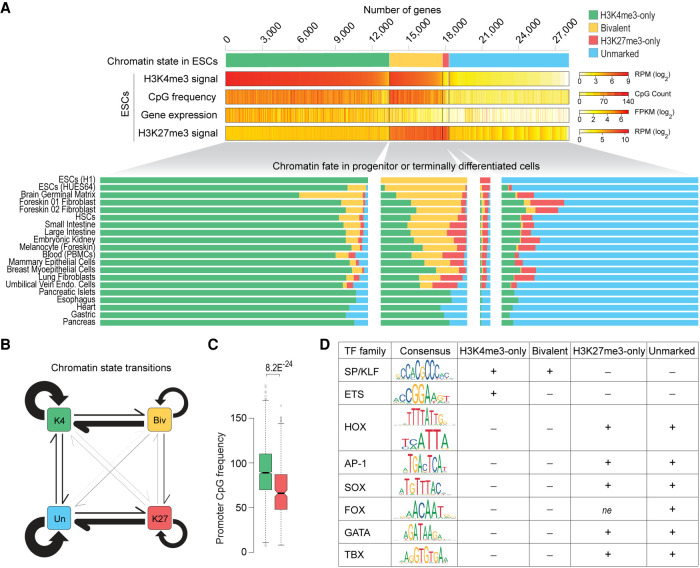
Figure 7.
Chromatin fate and sequence characteristics of bivalent promoters. (A, top) Genes are grouped into four classes based on their chromatin state, defined based on H3K4me3 (±500 bp of TSS) and/or H3K27me3 (±2 kb of TSS) enrichment at gene promoters in human ESCs. H3K4me3 and H3K27me3 levels, CpG density (±500 bp of TSS), and gene expression are shown. (Bottom) Chromatin states of the same four gene classes in various cell types. (B) Schematic summarizing chromatin state transitions of gene promoters from one state to another. Arrows represent state transitions. The thicker the arrow, the more frequently that transition is observed. (K4) H3K4me3-only; (Biv) bivalent; (K27) H3K27me3-only; (Un) unmarked. (C) Box plot showing distribution of CpG density at promoters of bivalent genes (in ESCs) that predominantly resolve into H3K4me3-only (green, left) or H3K27me3-only (red, right) state in other cell types. P-value calculated using two-sided Wilcoxon rank-sum test. (D) Binding motifs for various transcription factor (TF) families and their enrichment within promoters (±500 bp of TSS) of the four genes classes defined in A. (±) Over/under-enrichment; (ne) no enrichment. See also Supplemental Figure S10 and Supplemental Table S10.

