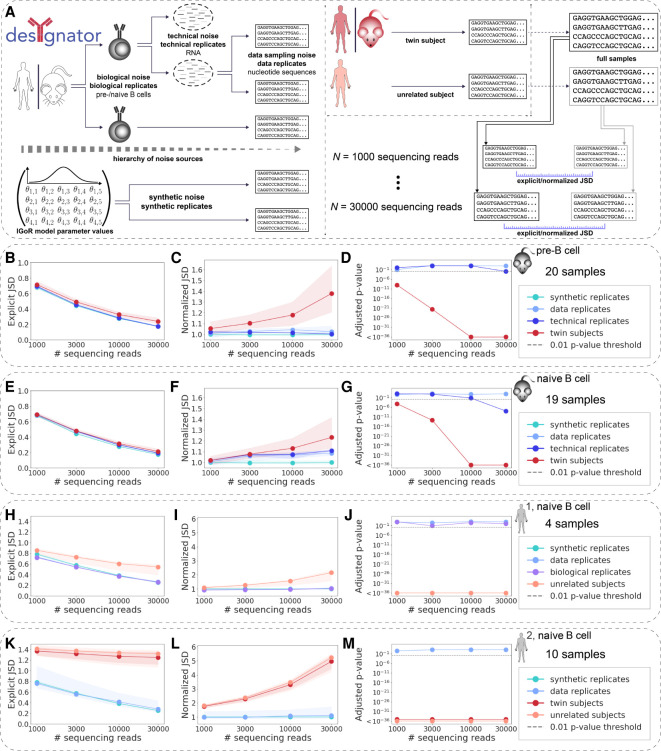
Figure 2.
RGMPs are individual-specific independent of the degree of immunogenetic similarity between individuals. (A) Different sources of AIRR-seq noise may arise impacting RGMP inference. To account for these sources of noise, different kinds of replicates are necessary. Specifically, biological replicates (i.e., biological samples obtained from the same individual) allow for observing biological noise; technical replicates (an RNA sample that was split, and the parts were sequenced independently) allow for observing technical noise; and data replicates (subsamples of the same AIRR FASTA file, termed “full sample” in the figure) allow for observing data sampling noise. Samples obtained from different (either twin or unrelated) subjects incorporate all these aforementioned sources of noise along with the associated potential nongenetic or genetic individual differences between their RGMPs. Synthetic replicates (synthetic samples generated using the same RGMP sets) allow for observing synthetic noise. (B) Explicit Jensen–Shannon divergence (JSD) between RGMP inferred from samples differing by several levels of noise: synthetic replicates; data replicates; technical replicates; twin mice. We computed the explicit JSD for random subsets of [1000, 3000, 10,000, 30,000] sequencing reads taken from samples of the MOUSE_PRE data set (19 IgH pre–B cell samples from C57BL/6 mice and one technical replicate, see Methods, “Experimental immunoglobulin sequencing data”). Circles correspond to the median explicit JSD; shaded areas correspond to the whole range of the explicit JSD for the given sample size and pair type (from minimum to maximum). (C) The amount of noise that accounts for the difference between synthetic replicates is quantified using the explicit JSD. This can be considered as the lower bound of noise in our system. We then normalized the explicit JSD by this lower bound. (D) To test whether the difference between a pair of samples is significantly higher than the difference between data replicates, we adapted the Student's t-test. The adjusted P-values for data and technical replicates were above the 0.01 threshold for each sample size except 30,000 for technical replicates. The adjusted P-values for twin subjects were below the 0.01 threshold for all sample sizes, indicating that the recombination models of the twin subjects are not identical. (E–G) Same as B–D but computed for the MOUSE_NAIVE data set (19 IgH naive B cell samples from C57BL/6 mice and one technical replicate). The twin subjects are closer to each other than in the pre–B cell case. The P-values of the statistical test, as in D, indicated RGMP of cross-subject samples differed systematically. (H–J) Same as B–D but computed for the HUMAN1 data set (three IgH naive B cell samples of healthy Caucasian male donors and one biological replicate). For all samples, individually restricted germline allele databases were constructed. The considered sample pair types are synthetic replicates, data replicates, biological replicates, and unrelated subjects. P-values indicate that biological as well as technical replicates were generated with the same RGMPs and that RGMPs differed across unrelated human individuals. (K–M) Same as B–D but computed for the HUMAN2 data set (IgH naive B cell samples from five pairs of MZ twins). For all samples, individually restricted germline allele databases were constructed (Methods, “An approach to building personalized RGMs that are robust to allelic variability of IGHV genes”). The considered sample pair types are synthetic replicates, data replicates, twin subjects, and unrelated subjects. P-values indicate that RGMPs of human MZ twins differ. All P-values were adjusted using the Bonferroni correction within one data set. The significance threshold of P = 0.01 is indicated by a gray dashed line.

