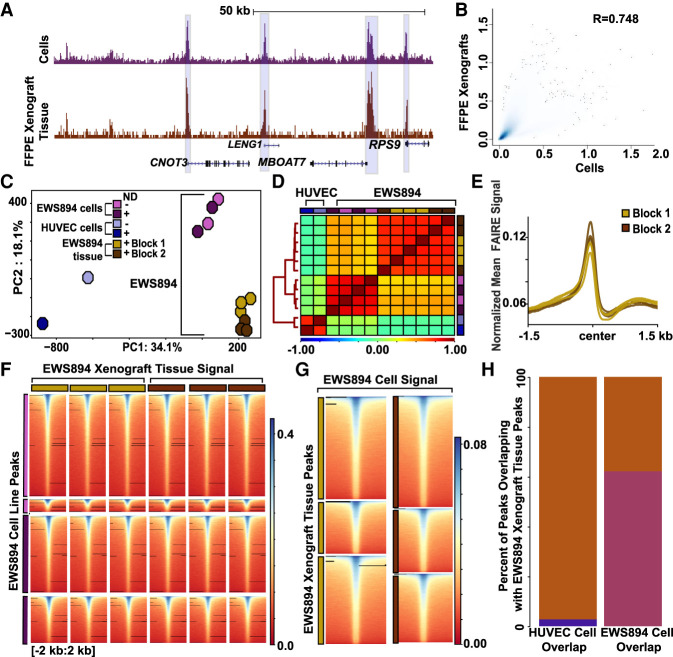
Figure 4.
Nanodroplet FAIRE identifies cell-type-specific regions of accessible chromatin from FFPE xenograft tissue. (A) Normalized FAIRE-seq sequencing tracks of EWS894 cell line signal (FAIRE replicates with and without nanodroplets combined) and EWS894 xenograft FFPE tissue (two tissue blocks, three replicates each, combined). Cell line signal depicted in purple, FFPE tissue signal in brown. Regions of enrichment shared across all tracks are highlighted in blue. (B) Correlation of genome-wide signal (300-bp windows), between EWS894 cells (replicates pooled), and EWS894 xenograft tissue (replicates and blocks pooled). Spearman's correlation coefficient is shown. (C) Top two principal components of mean FAIRE-seq signal in the union set of peaks called across all data sets, EWS894 cells (lavender, without nanodroplets; purple, with nanodroplets), EWS894 xenograft tissue (gold, FFPE block 1; brown, FFPE block 2), and HUVEC cell lines (sky blue, without nanodroplets; blue, with nanodroplets). Each symbol represents a FAIRE-seq data set. (D) Spearman's correlation of mean FAIRE-seq signal in union set of peaks called across all replicates in EWS894 (cells and xenografts) and HUVEC (cells). Distances across samples depicted by tree on left, determined by the nearest point algorithm. (E) Normalized mean EWS894 FFPE FAIRE signal in Block 1 (gold) and Block 2 (brown) replicates at all transcription start sites with non-zero signal genome-wide. Enrichment 3 kb around transcription start sites is shown. (F) Heatmap of signal in xenografts tissue replicates 4 kb around center of replicate-specific regions of enrichment identified in EWS894 cell data sets. (G) Mean normalized FAIRE-seq signal in EWS894 cell FAIRE (all replicates pooled), 4 kb around the center of FFPE tissue-replicate-specific regions of enrichment sets from Block 1 (gold) and Block 2 (brown), three replicates each. (H) Bar plot of the percentage of HUVEC cell peaks (all replicates pooled, blue) and EWS894 cell peaks (all replicates pooled, purple) that overlap with EWS894 xenograft peaks called (all replicates pooled, brown).

