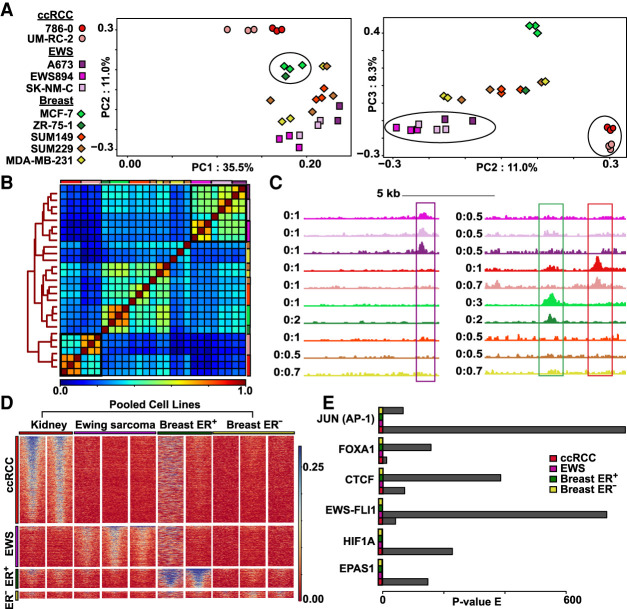
Figure 5.
Nanodroplet FAIRE identifies tumor-type-specific chromatin signatures from xenograft FFPE tissue. (A) Top three principal components from mean signal in union set of regions of enrichment called across all xenograft carcinoma tissue blocks. Tumor categories defined by symbols: (circles) ccRCC; (squares) EWS894; (diamonds) breast carcinoma. Number of blocks per cell line: 786-0, n = 3; UM-RC-2, n = 3; A673, n = 2; EWS894, n = 3; SK-NM-C, n = 3; MCF-7, n = 3; ZR-75-1, n = 1; SUM149, n = 3; SUM229, n = 3; MDA-MB-231, n = 3). Xenograft replicates defined by colors. Clustering of ccRCC group, breast ER+ group, and EWS894 group highlighted within PCA by black circles. (B) Spearman's correlation heatmap of mean signal in union set of regions of enrichment called across all xenograft tissue replicates. Xenografts are color coded by cell line outside the heatmap perimeter (top and right); color coding matches legend defined in A. Clustering distance tree across all replicates depicted on the left of the heatmap. Legend of correlation coefficient scores depicted at the bottom of the heatmap. Clusters of tumor-type-specific cell lines defined by tree nodes highlighted with black boxes within the heatmap. (C) Examples of regions of enrichment from within the EWS894, breast ER+, and ccRCC TSRs (tumor-type-specific regions). Replicates for each xenograft pooled into one signal track. Tracks colored by xenograft to match legend defined in A. Signal at depicted signature regions across all cell line tracks highlighted within box (Ewing sarcoma signature region defined by purple box, breast ER+ region by green box, ccRCC region by red box). (D) Heatmap of xenograft tissue FAIRE signal at each TSR. TSRs defined on the left with each region as a row; pooled xenografts grouped by tumor type define columns. Each TSR heatmap is sorted by signal in the first cell line within that tumor type category. (E) Motifs enriched at TSR. P-value of enrichment for each motif within each TSR displayed for six relevant transcription factors.

