Figure 6.
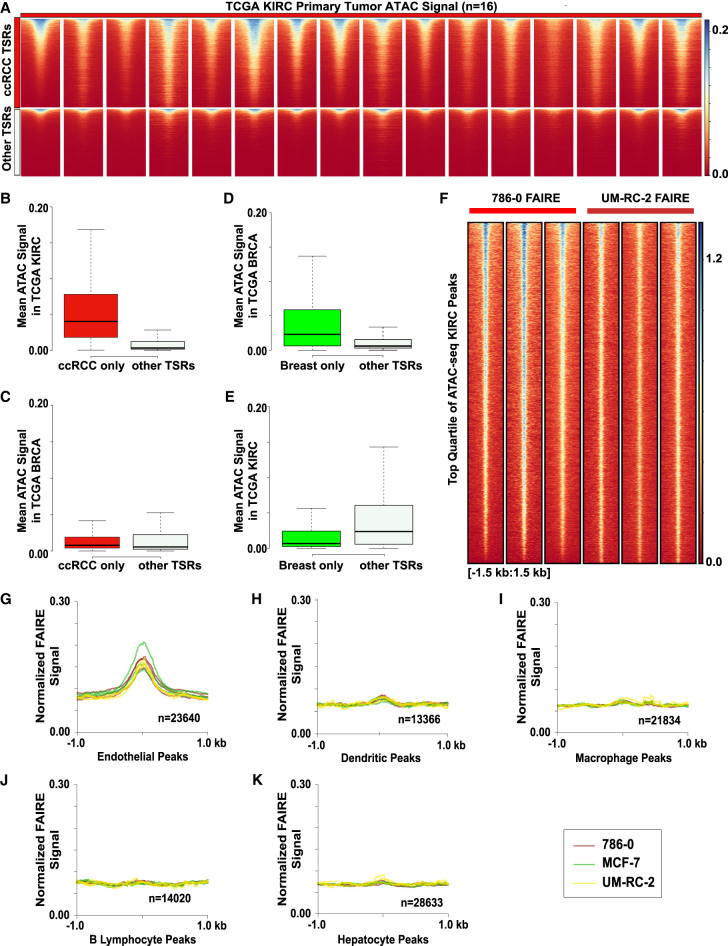
Tumor-specific regions identified by nanodroplet FAIRE predict chromatin states in primary tumors and murine chromatin accessibility profiles identify stromal cells. (A) ATAC-seq signal across KIRC primary tumor samples (n = 16, TCGA) at ccRCC TSRs (n = 10,120) and other TSRs (n = 7737). (B) Mean signal across all KIRC samples at each region within the ccRCC TSRs (red) and other TSRs (gray), outliers excluded. (C) Mean signal across all BRCA samples (n = 44) at each region within the ccRCC TSRs (red) and other TSRs (gray), outliers excluded. (D) Mean signal across all BRCA samples at each region within the breast TSRs (n = 3019) and other TSRs (n = 14,838), outliers excluded. (E) Box plot of mean signal across all KIRC samples at each region within the breast TSRs and other TSRs, outliers excluded. (F) Volcano plot of FFPE FAIRE signal in 786-0 and UM-RC-2 replicates 3 kb around the center of the top quartile of TCGA KIRC peaks called. (G–K) Normalized mean xenograft FAIRE signal in 786-0 (brown), MCF-7 (green), and UM-RC-2 (yellow) replicates at cell-type-specific peaks (endothelial, dendritic, macrophage, B lymphocyte, hepatocytes, respectively) as defined from sci-ATAC-seq Mouse Atlas. Signal 2 kb around the peak centers shown.

