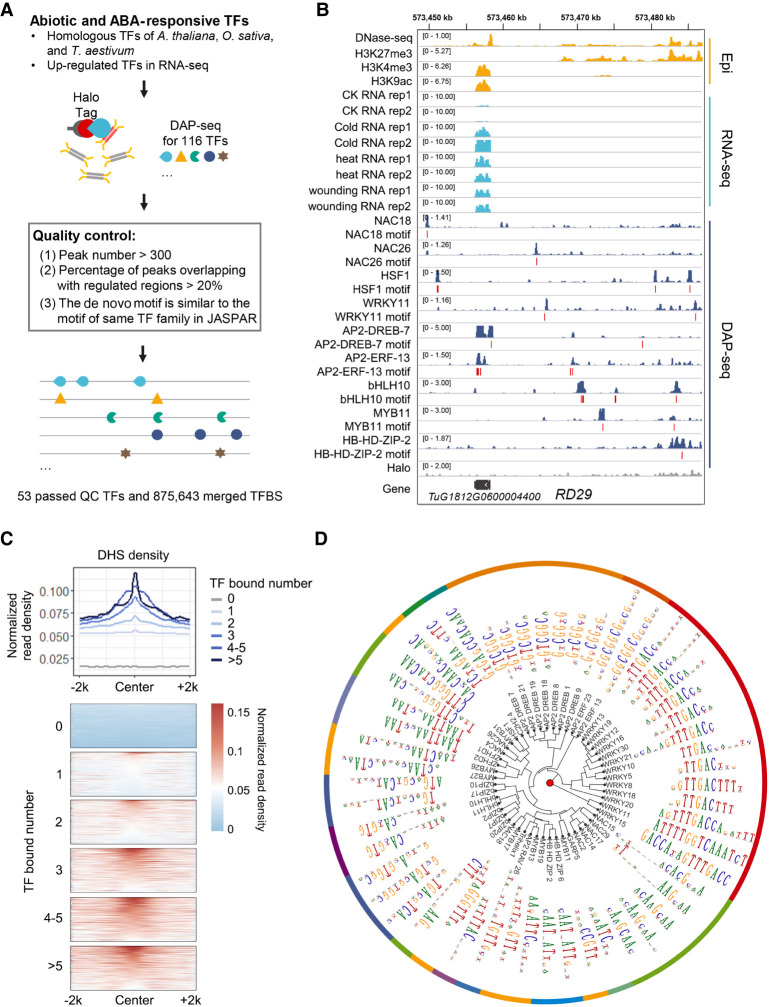
Figure 1.
Genome-wide binding of wheat transcription factors underlying responses to environmental stimuli. (A) Schematic of the experimental design and filtering steps. The detailed filtering steps were listed in Supplemental Table S2. (B) Genomic tracks illustrating the targeting of RD29 by a subset of these TFs as well as locations of representative motifs. (C) DHS read density of TFBSs. TFBSs were grouped according to the number of binding TFs. DHS signal densities (bin size 50 bp) within a 4-kb window centered on merged TFBS centers. (D) Clustering of the top motif identified for each TF. Dendrogram based on motif similarity.

