Figure 3.
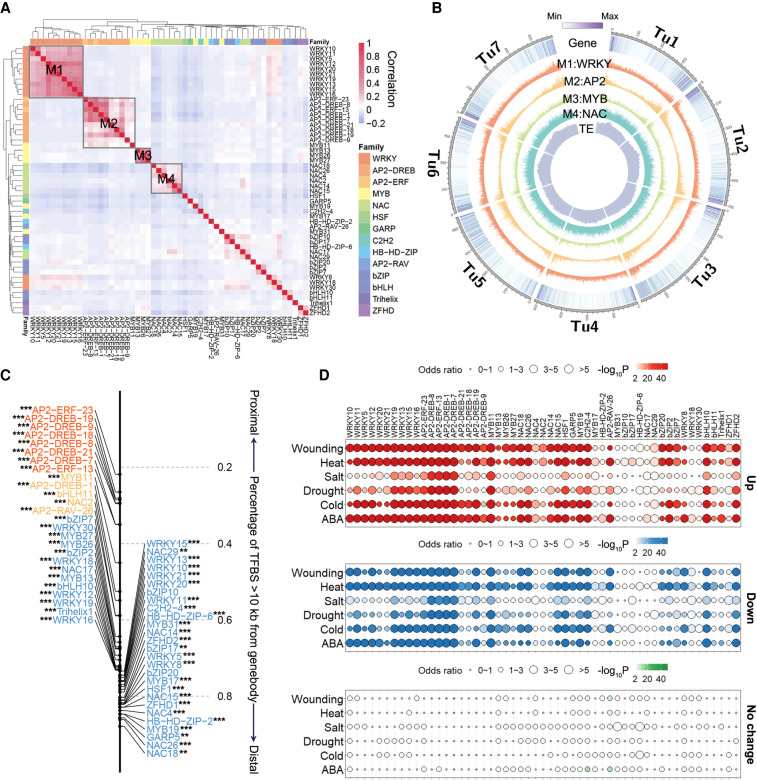
Distribution of TFBSs and stress responsiveness of TF targets. (A) Clustering of TF binding correlations based on occurrence of DAP-seq peaks shows that TFs from the same family generally have similar binding profiles. (B) Circos plot showing the genomic distribution of the four largest TFBS clusters shown in A. The visualization of genomic distribution was performed by Circos (Krzywinski et al. 2009). (C) Fraction of peaks for each TF localized to the distal regions (>10 kb from the nearest gene). For each TF peak set, the distance to the TSS of the nearest gene was compared with randomly selected regions using an unpaired Student's t-test. Almost all TFs are closer to gene body regions. (**) P < 0.01, (***) P < 0.001 (H1: expected distance > observed distance). (D) Enrichment of TF proximal targets in stress-responsive and non-stress-responsive genes. The top panel (red), middle panel (blue), and bottom panel (green) are the enrichment of TF targets in up-regulated genes, down-regulated genes, and genes with no significant expression change in response to stresses. The color range represents the enrichment P value and the circle size represents the odds ratio. Genes with FPKM > 1 were used for the analysis.

