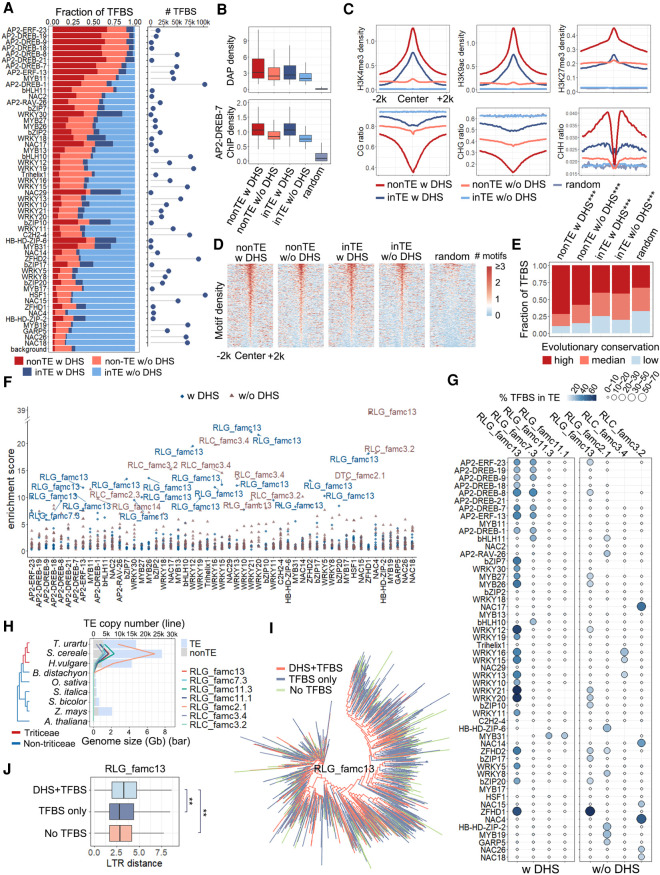
Figure 4.
Pervasive association of TFBSs and TEs in Tu. (A) Proportion of the TFBSs that occurred in TEs with (dark blue) or without (light blue) DHSs and non-TE regions with (dark red) or without (light red) DHSs. The numbers of all TFBSs are shown on the right. (B) DAP-seq density and AP2-DREB-7 ChIP-seq density distribution of non-TE TFBSs and TE-embedded TFBSs with or without DHSs. (C) Epigenetic profiles of TE-embedded and non-TE TFBSs. All figures represent the average signal density at 50-bp resolution within a 4-kb window centered on peak summits. Top panel: Regulatory histone marks, including H3K4me3, H3K27me3, and H3K9ac. Bottom panel: DNA methylation levels in three contexts. (D,E) Distribution of motifs (D) and conservation levels (E) in non-TE TFBSs and TE-embedded TFBSs with or without DHSs. (D) The number of motif occurrences (bin size 50 bp) within a 4-kb window centered on the merged TFBS centers. The unions of the primary motifs of these TFs were used. (E) Conservation score is a measure of sequence conservation across wheat species. The 0.33 quantile (0.16) and 0.66 quantile (0.25) of the conservation score of all peaks were used to define the degree of conservation. 0 < score < 0.16 for low conservation, 0.16 ≤ score < 0.25 for median conservation, score ≥0.25 for high conservation. For each TFBS set, the number of the TFBSs in each conservation category was compared with a randomly selected set using a χ2 test. (***) P < 0.001. (F) Specific TE families enriched among TFBSs. Blue dots and brown triangles represent families contributed to TE-embedded TFBS overlapping and not overlapping with DHSs, respectively. Highly enriched TE families (enrichment score > 9) are labeled with family names. (G) Percentage of TFBSs in TE-embedded regions with or without DHSs. The color range and circle size represent the percentage of TFBSs overlapping with TEs. (H) TE copy number (line plot) of each family (represented by different colors) during evolution. The genome sizes are shown as a bar plot, light blue representing TEs and light gray representing non-TEs. (I) Dendrogram showing the sequence similarity between RLG family 13 members. (J) Age of different groups of RLG family 13 measured by sequence similarity of LTR from both ends. A Wilcoxon signed-rank test was used to compare the LTR distance of different groups. (**) P < 0.01 (H1: the LTR sequence of TEs with DHSs and TFBSs were more divergent than other TEs).

