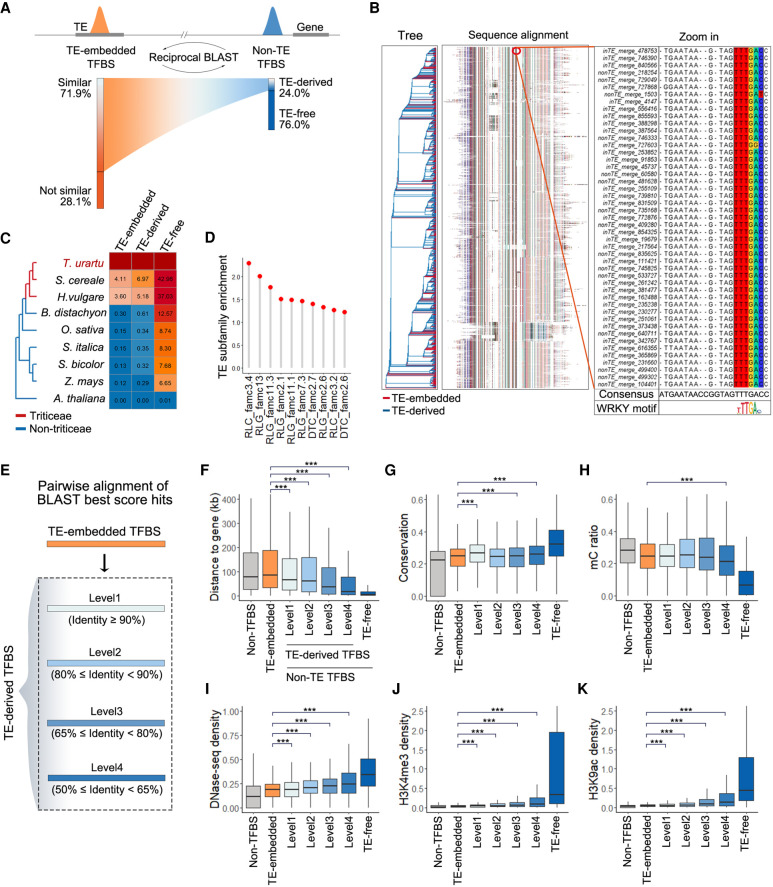
Figure 5.
Ongoing degeneration of remnant TEs to TFBSs in non-TE regions. (A) Left: Fraction of TE-embedded TFBSs showing high sequence similarity to non-TE TFBSs. Right: Fraction of non-TE TFBSs with high sequence similarity to TE-embedded TFBSs. (B) Multiple sequence alignment of one cluster of TE-embedded and TE-derived TFBSs based on sequence similarity (n = 2034). The alignment in the red circle is enlarged on the right. The alignment also shows a particularly high degree of sequence identity for the WRKY binding motif. (C) Fractions of homologous sequences in other species for TE-embedded TFBSs, TE-derived TFBSs in non-TE regions, and other non-TE TFBSs. (D) Enriched TE subfamilies with TFBSs showing sequence similarity to non-TE TFBSs. (E) TE-derived TFBSs were grouped according to the sequence divergence with TEs. Level 1 represents low divergence and level 4 represents high divergence. (F) Distribution of the distance between TFBSs and the proximal genes. TFBSs were classified as TE-embedded, TE-derived, and TE-free; 30,000 non-TFBS regions were randomly sampled from genomic loci without TFBSs. A Wilcoxon signed-rank test was used to compare the TE-derived TFBSs and TE-embedded TFBSs. (***) P < 0.001 (H1: TE-derived TFBSs were closer to genes than TE-embedded TFBSs). (G) Distribution of sequence conservation for different groups of TFBSs and non-TFBSs in TEs. A Wilcoxon signed-rank test was used to compare the TE-derived TFBSs and TE-embedded TFBSs. (***) P < 0.001 (H1: TE-derived TFBSs were more conservative than TE-embedded TFBSs). (H–K) Epigenetic feature distribution of TFBSs embedded in TEs or localized to non-TE regions and non-TFBSs. (H) DNA methylation. (I) DHS density. (J,K) Regulatory histone mark distribution. A Wilcoxon signed-rank test was used to compare the TE-derived TFBSs and TE-embedded TFBSs. (***) P < 0.001. (For H, H1: TE-derived TFBSs had lower methylation levels than TE-embedded TFBSs. For I–K, H1: TE-derived TFBSs had more active epigenetic signatures than TE-embedded TFBSs.)

