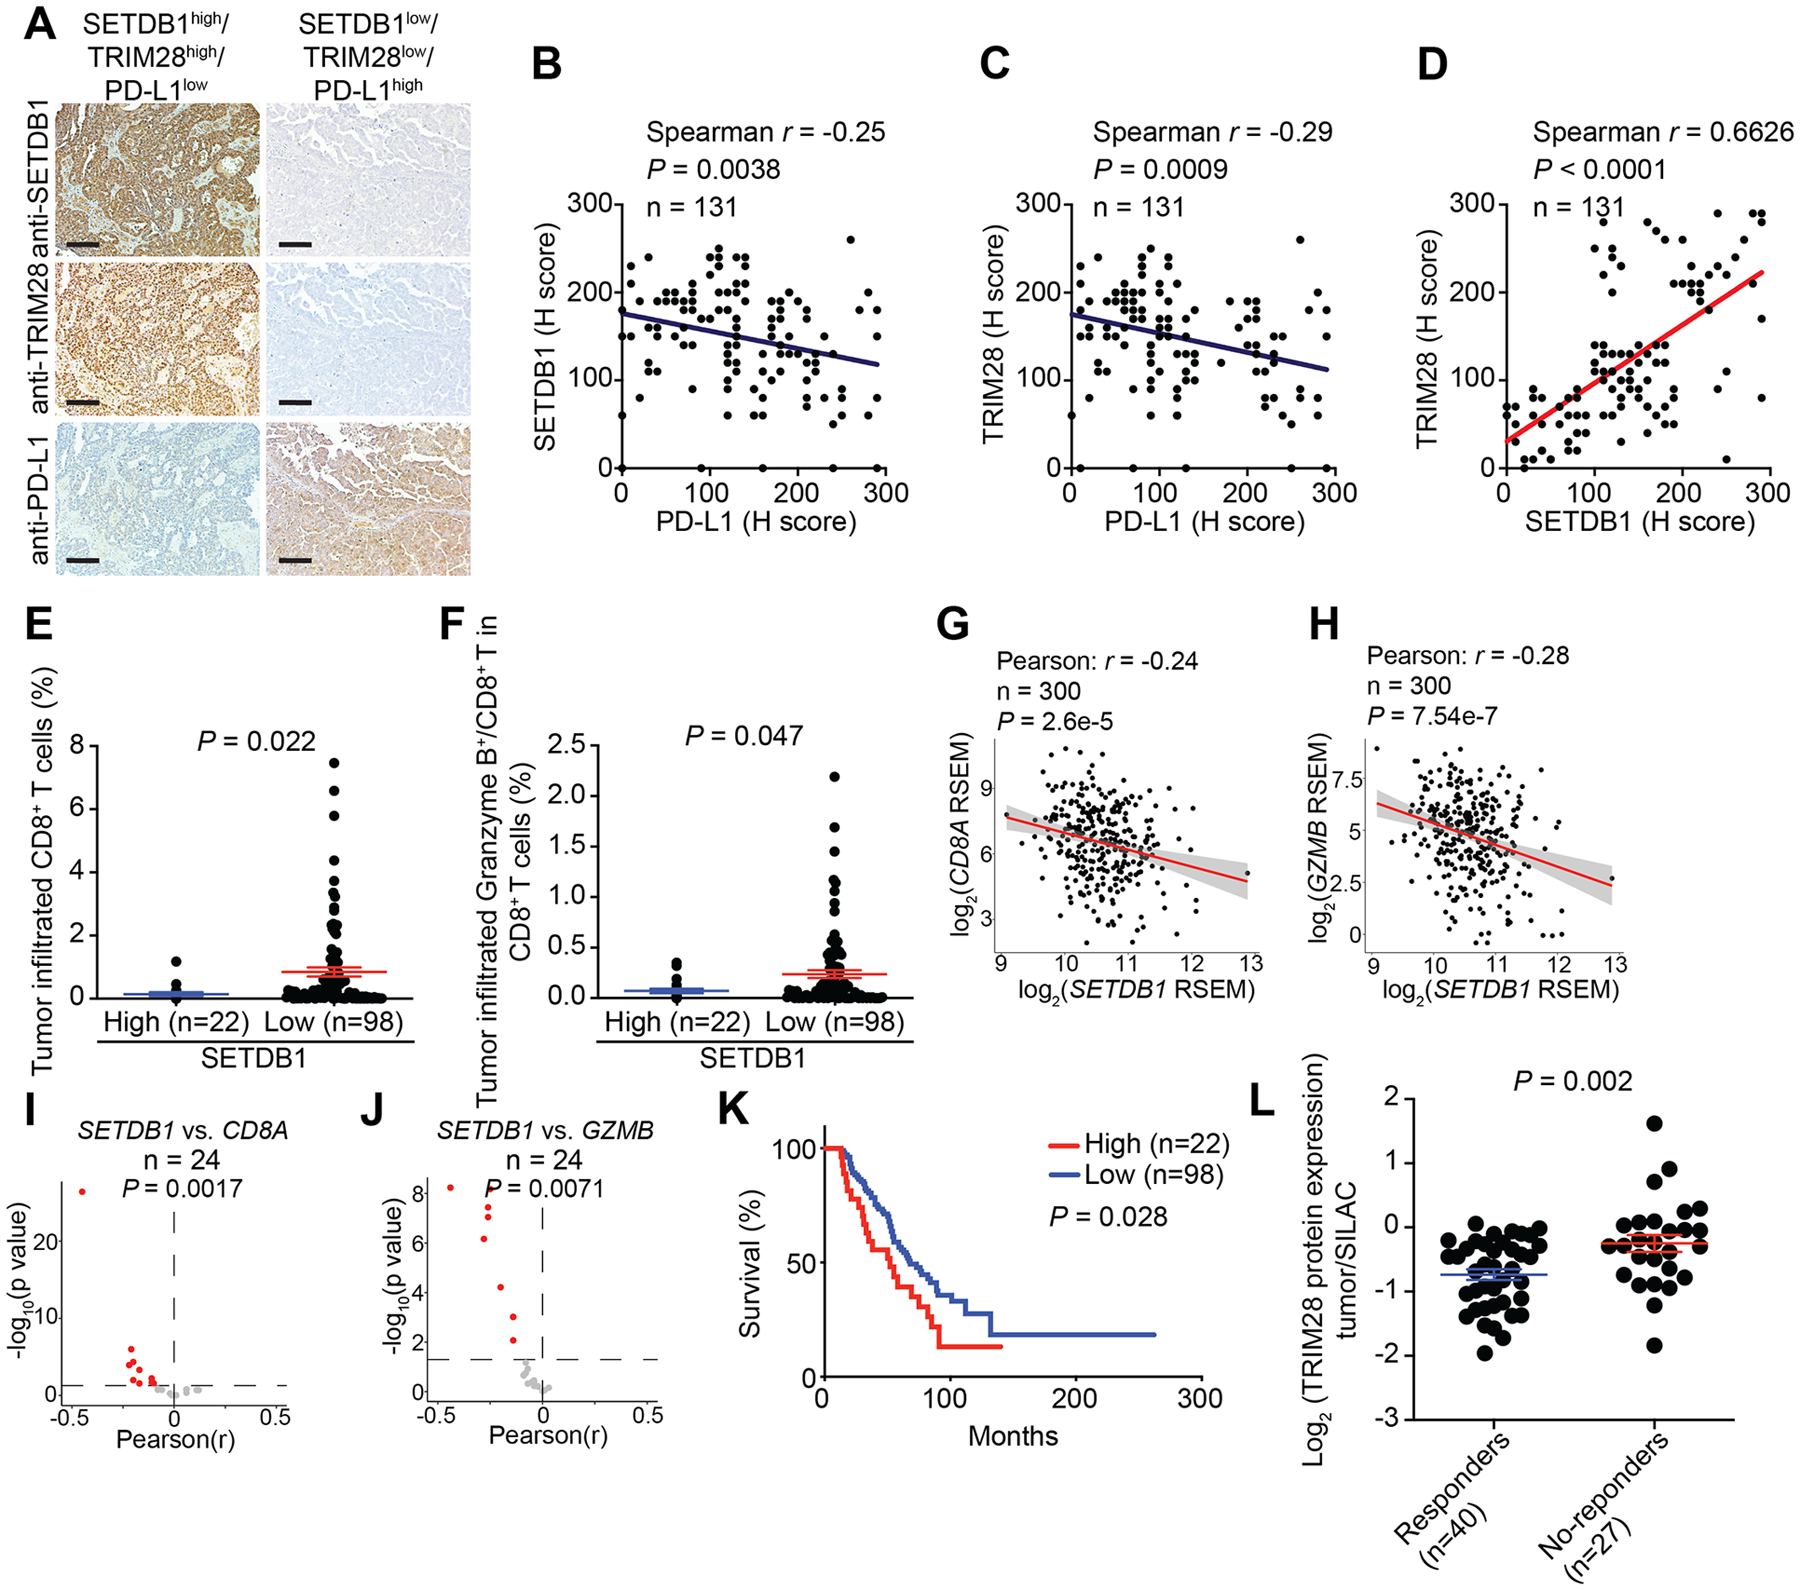
Figure 2: SETDB1–TRIM28 negatively correlates with infiltration of effector CD8+ T cells.

A, Representative staining of SETDB1, TRIM28 and PD-L1 in SETDB1–TRIM28 high or low expressing tumors from a TMA with 131 HGSOC cases. Scale bar = 100 μm. B, Negative correlation between SETDB1 and PD-L1 expression. C, Negative correlation between TRIM28 and PD-L1 expression. D, Positive correlation between SETDB1 and TRIM28 expression. E, F, High SETDB1 expression correlates with significantly lower tumor infiltrated CD8+ T cells (E) and Granzyme B+/CD8+ T cells (F). G, H, Negative correlation between SETDB1 and CD8A (G) or GZMB (H) in RNA-seq analysis using the TCGA ovarian cancer dataset. I, J, Significant negative correlation between SETDB1 and CD8A (I) or GZMB (J) expression based on RNA-seq analysis from 24 TCGA cancer types with at least 100 patients. K, Overall survival of patients with high or low SETDB1 from the TMA based on Kaplan-Meier analysis. L, TRIM28 protein is expressed at a significantly higher levels in melanoma patients who failed to respond to anti–PD-1 therapy compared with those responded to the therapy based on a publicly available proteomics dataset (35). Data represent mean ± SEM. P values were calculated using a two-tailed student t test except in B–D, G–J by Pearson R analysis, and K by log rank test.
