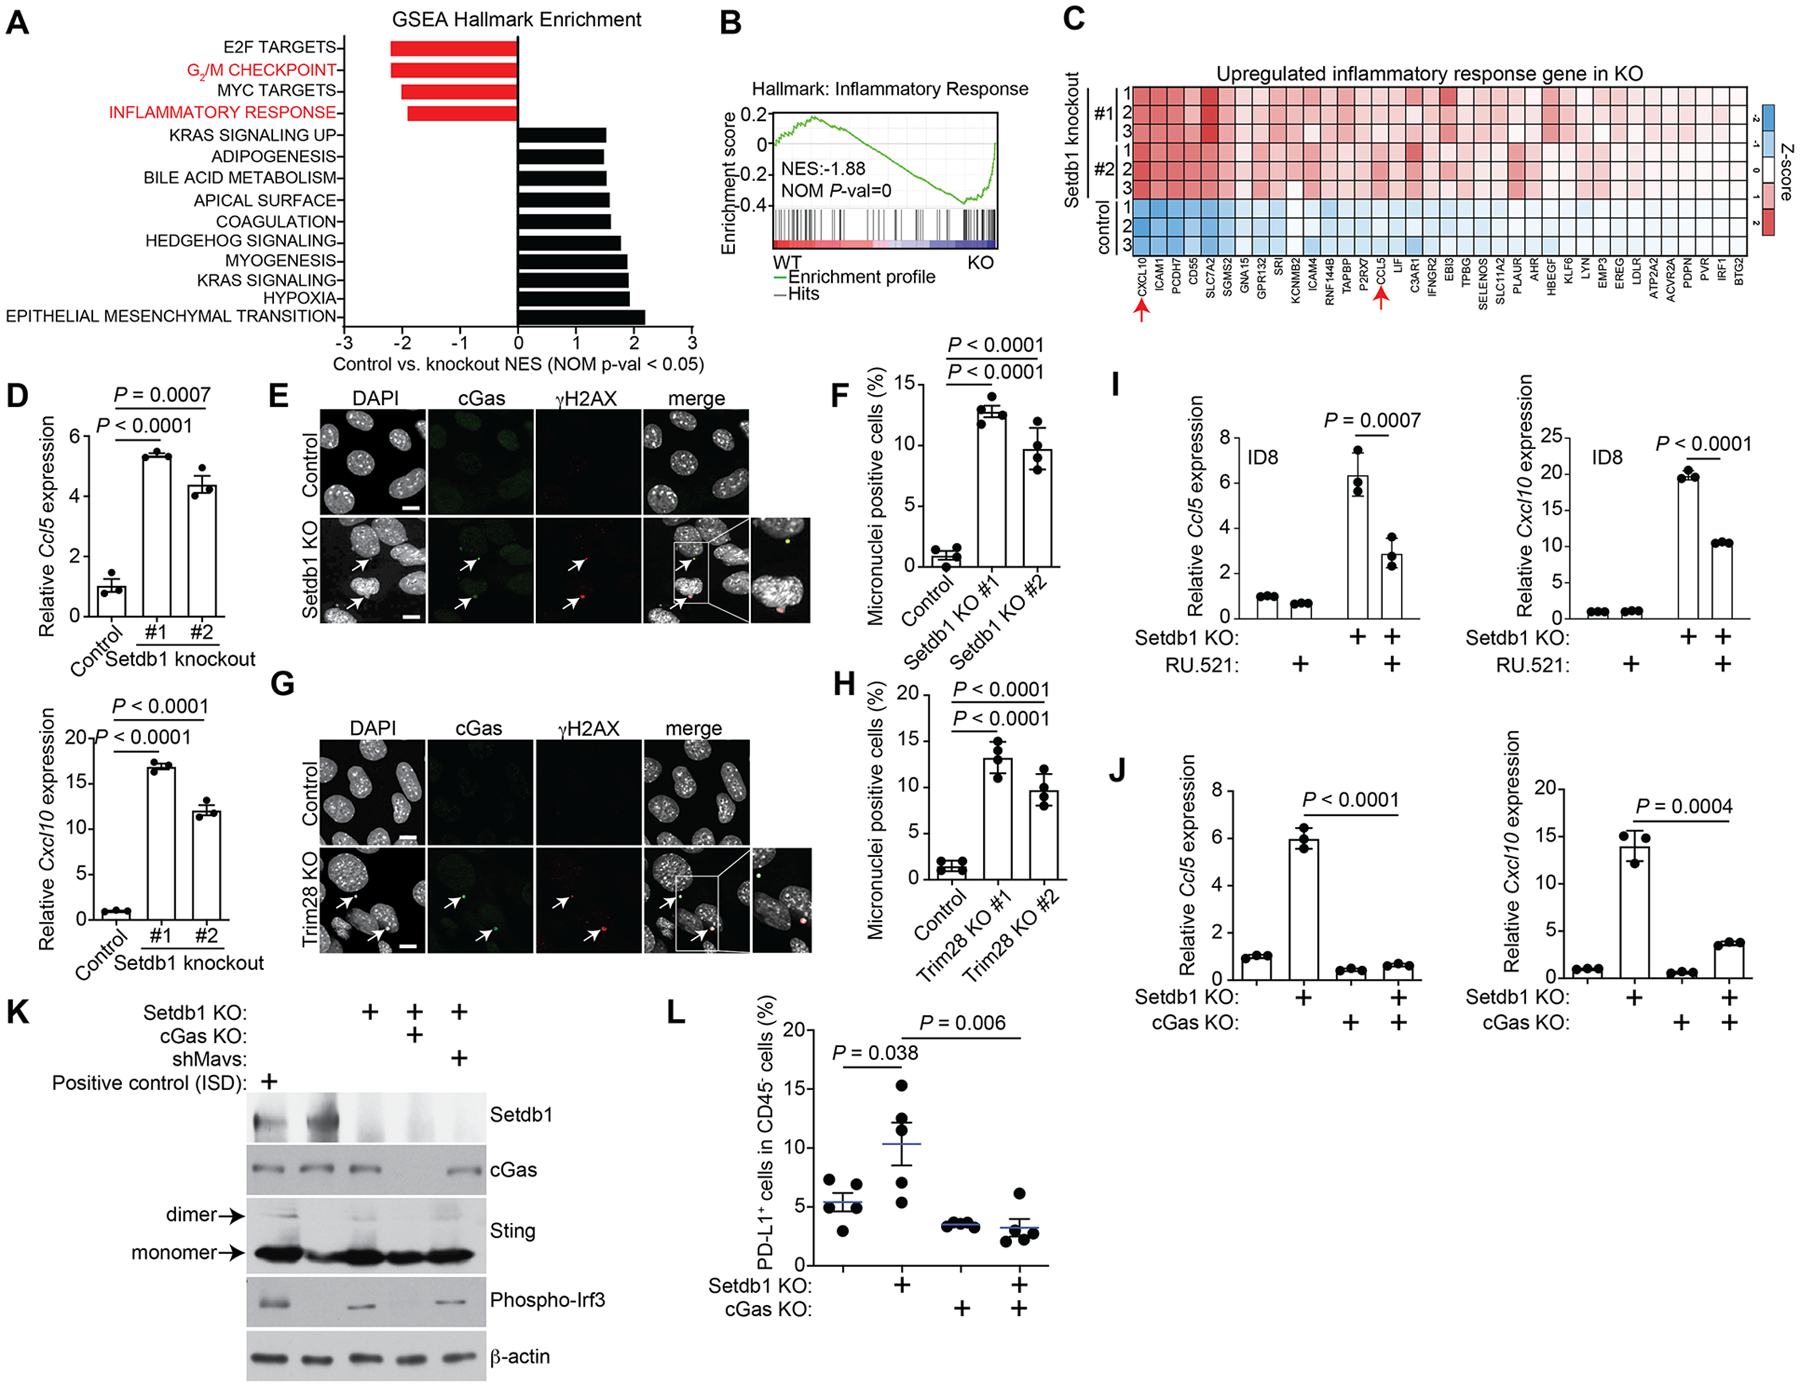
Figure 3: SETDB1–TRIM28 loss activates the cGAS-STING pathway.

A, GSEA hallmark enrichment analysis of DEGs between control and Setdb1-knockout ID8 cells. B, Enrichment plot of GSEA for inflammatory response hallmark. C, Heatmap of the inflammatory response hallmark genes upregulated in Setdb1-knockout ID8 cells. D, Expression of Ccl5 and Cxcl10 in control and the indicated Setdb1-knockout ID8 cells determined by RT-qPCR analysis. E, Immunofluorescence staining of cGas and γ-H2AX in control and Setdb1-knockout ID8 cells. Arrows point to examples of cGas and γH2AX positive micronuclei. Scale bar = 10 μm. F, Quantification of micronuclei-positive cells in control and indicated Setdb1-knockout ID8 cells. G, H, Same as E, F but for Trim28-knockout ID8 cells. I, Expression of Ccl5 and Cxcl10 in control and Setdb1-knockout ID8 cells treated with or without the cGAS inhibitor RU.521 (2.5 μg/ml for 48 h), as determined by RT-qPCR analysis. J, Expression of Ccl5 and Cxcl10 in control, Setdb1-knockout, cGas-knockout and cGas/Setdb1-double knockout ID8 cells determined by RT-qPCR analysis. K, Expression of Setdb1, cGas, Sting, phospho-Irf3 and a loading control β-actin in the indicated cells determined by immunoblot. L, Percentage of PD-L1+ tumor cells in tumors formed by orthotopic injection of the indicated ID8 cell lines into C57BL/6J mice. Data represent mean ± SEM, n = 3 biologically independent experiments unless otherwise stated. P values were calculated using a two-tailed student t test except in B by GSEA analysis.
