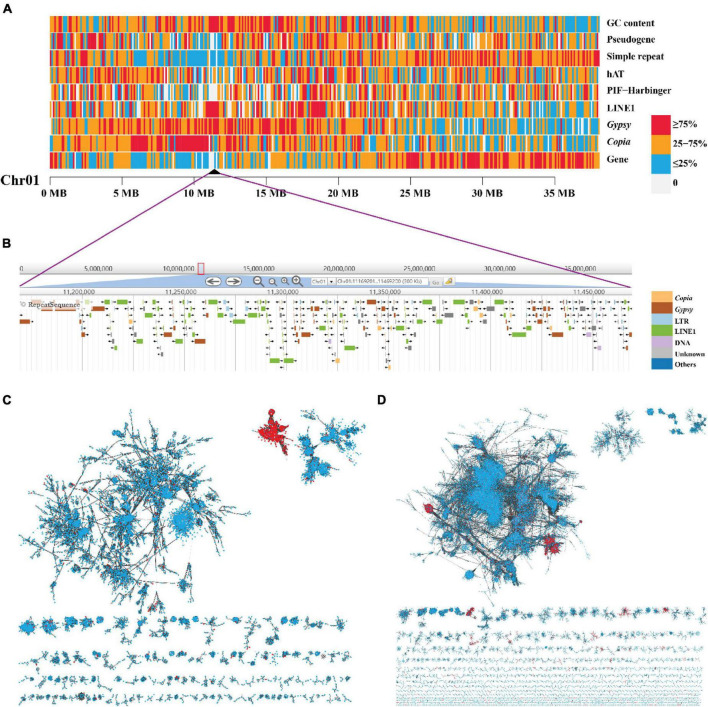
FIGURE 4.
The high enrichment of LINE1 and Gypsy elements and their independent accumulation in the centromere of Chromosome 1. (A) A heat map view of protein-coding genes, TE (Copia, Gypsy, LINE1, PIF-Harbinger, and hAT), simple repeat, pseudogene, and GC content density in 100-Kb non-overlap sliding windows along chromosome 1 “Chr01.” The black triangle represents the predicted location of centromere. (B) The zoom in on the centromeric region. (C,D) The phylogenetic network of LINE1 and Gypsy elements, respectively. Each node in the network represents a single element. The links were defined as blast + alignment “bitscore” values (red, element in centromeric regions; blue, element in non-centromeric regions).

