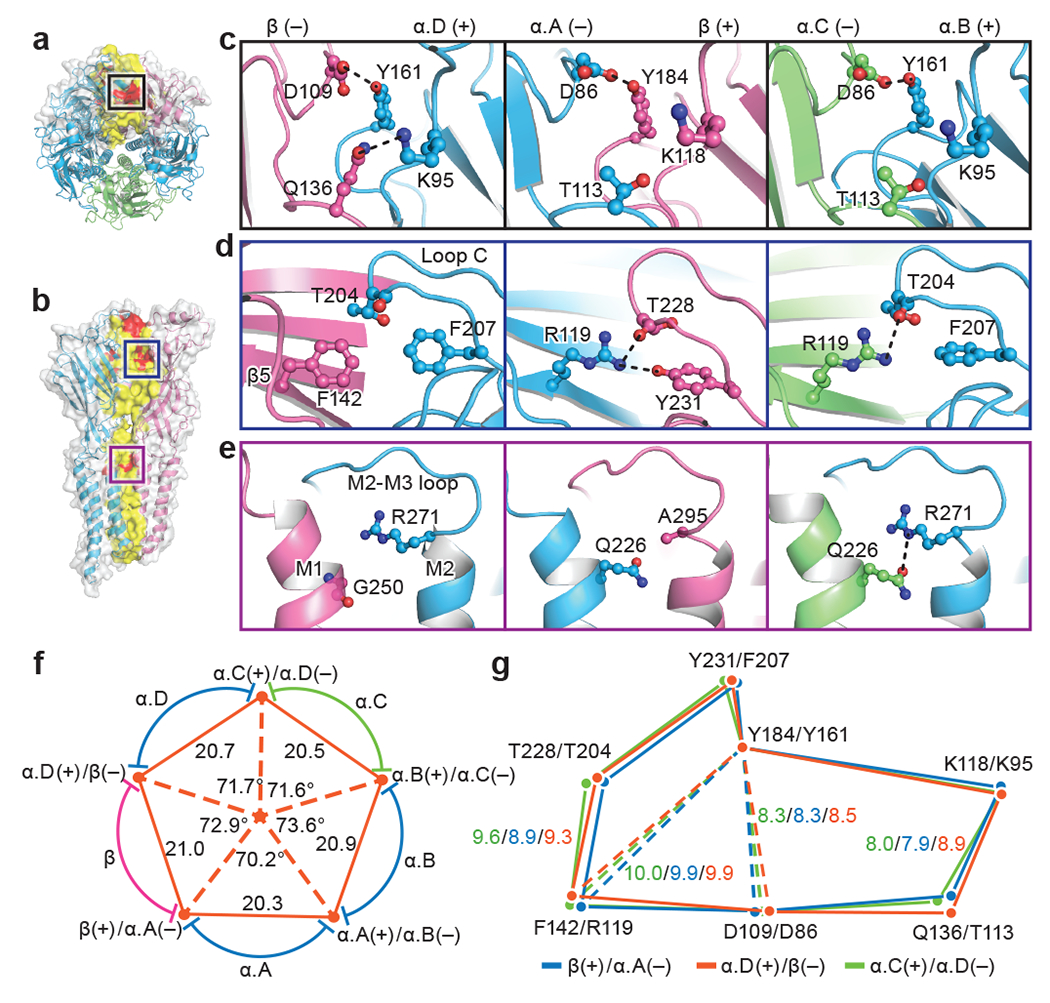
Fig. 2. Inter-subunit interactions.

a, b, Top-down (a) and side view (b) of native GlyR, respectively. Subunits β and α.D shown in surface and cartoon representation and the other three α subunits shown in cartoon representation. Red indicates potential hydrogen bonds. Yellow indicates amino acids located at the interfaces. β subunit is colored in salmon; α.A, α.B and α.D colored in blue; and α.C colored in lime. Boxed areas are enlarged in panel (c), (d) and (e). c-e, View of the interfaces in the upper ECD (c), loop C (d) and ECD-TMD region (e) of α.D(+)/β(−), β(+)/α.A(−) and α.B(+)/α.C(−) interfaces (left to right). (+) and (−) represent different sides of each subunit. Dashed lines indicate hydrogen bonds and salt-bridges. Side chains of key residues are in ball-stick representation with oxygen in red, nitrogen in blue. f, Schematic diagram illustrating the distances and angles associated with interfaces. Five red dots at the vertex of the pentagon indicate the center of masses of two adjacent subunits. The center orange dot indicates the center of mass of the ECD. The interfaces formed by the adjacent subunits are labeled near the orange dots. Coloring as in panel (a). Distances are given in Å and the angles in degrees. g, Schematic diagram illustrating the relative positions of the amino acids shown in panels (c) to (e). Orange, green and blue polygons are created by the connection of the Cα atoms of these highlighted amino acids at the α.D(+)/β(−), α.B(+)/α.C(−) and β(+)/α.A(−) interfaces, respectively. Polygons are aligned by the superposition of βY184 and αY161. Distances are given in Å.
