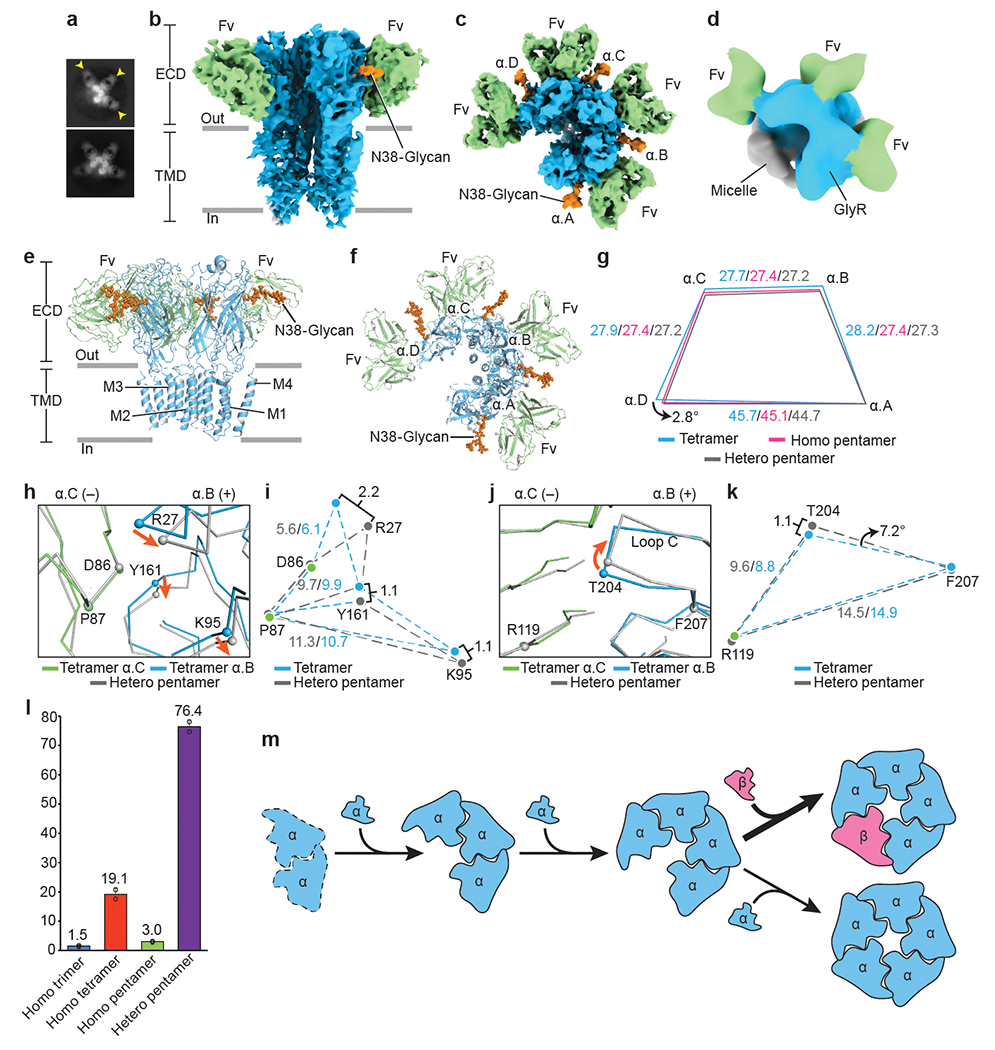
Fig. 3. Homomeric α assembly intermediates and model for GlyR assembly.

a, 2D class averages of homomeric α trimers and tetramers. Yellow arrows indicate bound 3D1 Fabs. b-c, Side (b) and top-down (c) views of homomeric α tetramer. 3D1 Fabs, α subunits and glycosylations colored in green, blue and orange, respectively. d, Top-down view of homomeric α trimer. Color coding as in panel (b). e-f, Side (e) and top-down (f) views of the atomic model of homomeric α tetramer in cartoon representation. Coloring as in panel (b). g, Schematic diagram illustrating changes in distances between α subunit centers of mass. Indicated values colored in blue, pink and grey are for homomeric tetramer, homomeric pentamer and heteromeric pentamer, respectively. All distances are denoted in Å. h, j, Superposition of the α.B(+)/α.C(−) interfaces from homomeric α tetramer and heteromeric pentamer. α.C subunit is in green and α.B in blue. Orange arrows indicate the movement of the Cα atoms. i, k, Schematic diagram illustrating the relative positions of amino acids shown in panel (h) and (j), respectively. All distances are given in Å. l, Bar plot showing particle distributions for each state (n=2). Percentage of particles is labeled above each bar. The corresponding data points were overlaid as black cycles. Data are presented as mean values +/− Standard Deviation (SD). m-q, Proposed model for GlyR assembly pathway. Dashed line in panel (m) indicates the missing structure. α and β subunits are colored in blue and salmon, respectively. Larger arrow before panel (p) indicates a higher probability.
