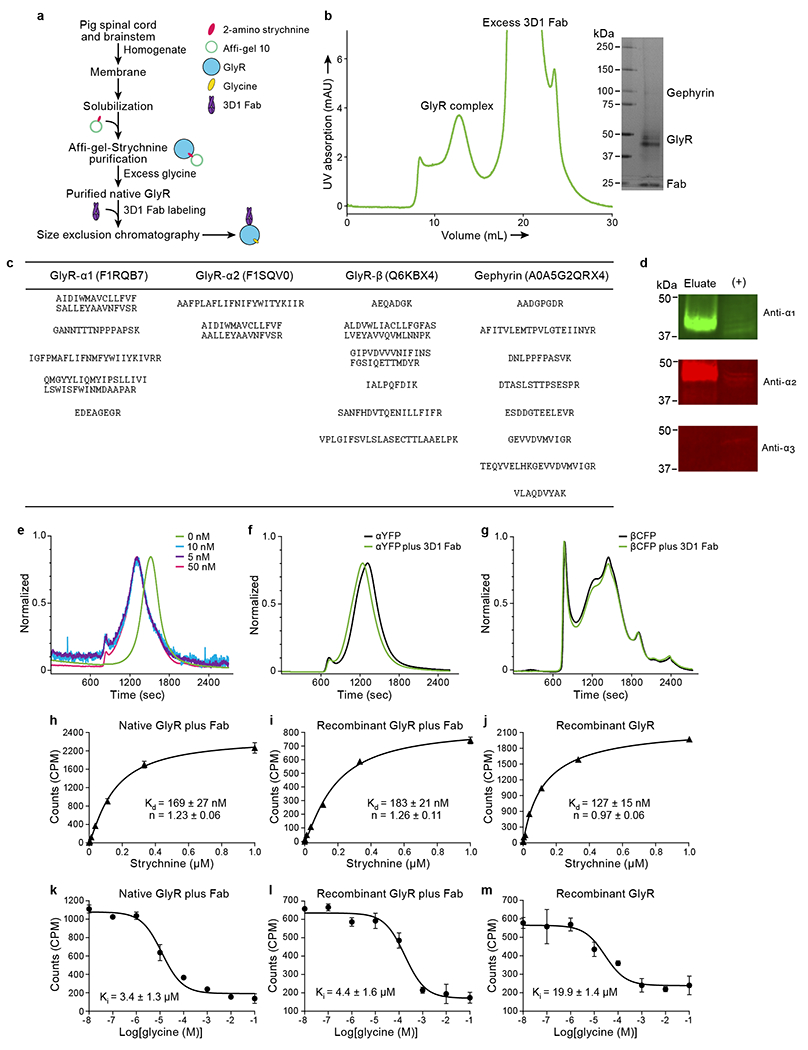
Extended Data Fig. 1. Biochemistry results related with native GlyRs.

a, Flow chart for native GlyR purification. b, Representative SEC profile for native GlyR in complex with the 3D1 Fab. Inset shows a typical silver staining of sodium dodecyl sulphate-polyacrylamide gel electrophoresis of native GlyR sample for cryo-EM grid preparation. c, Results from mass spectrometry (See Methods for more details). The table shows the identified peptides within the sample and the corresponding proteins with their gene accession numbers. d, Western blot analysis of isolated native GlyR eluted from strychnine column using antibodies against α1, α2, and α3. Positive control is the membrane extracts from rat brain. The experiments were repeated two times with similar results. e, FSEC profiles for mixing of different concentration of recombinant homomeric α pentamer with 3D1 Fab. f-g, FSEC profiles for mixing of YFP-tagged homomeric α1 GlyR (f) and CFP-tagged β GlyR (g), respectively. h-j, Saturation binding of 3H strychnine to native GlyRs with 3D1 Fab (h), recombinant expressed pig heteromeric GlyRs with (i) and without 3D1 Fab (j), respectively. Results are the average of three replicates and the error bars represent standard error of the mean (SEM) (n=3). k-m, The competitive binding of glycine to native GlyRs with 3D1 Fab (k), recombinant expressed pig heteromeric GlyR with (l) and without 3D1 Fab (m), respectively. Results are the average of three replicates and the error bars represent SEM (n=3). The hot ligand used here is 3H strychnine.
