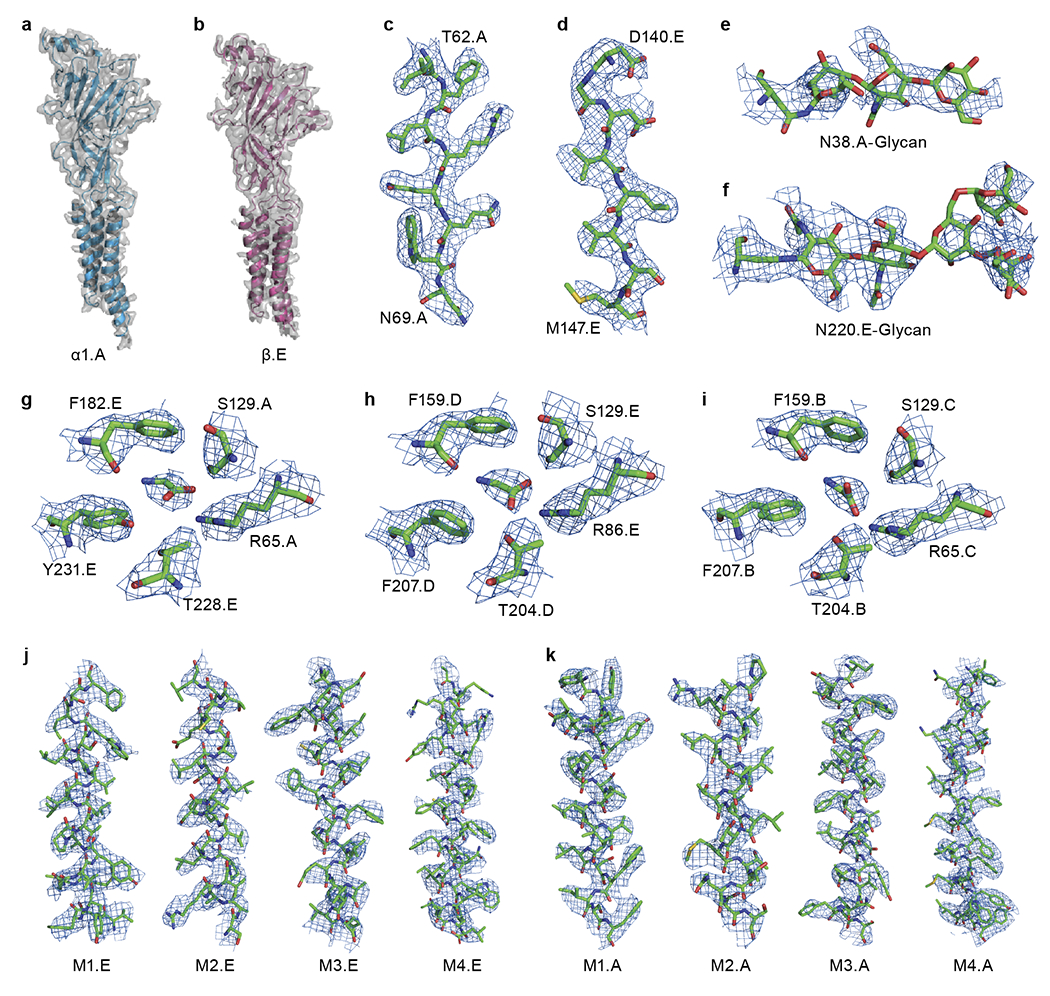
Extended Data Fig. 3. Representative densities.

a-b, EM density segments for α.A (a) and β (b) subunits, respectively. The model is shown in carton representation. The density is shown in surface representation. c-d, Representative densities for light (c) and heavy chain (d) of 3D1 Fab. Regions are numbered. e-f, Representative densities for glycosylation on α.A (e) and β (f) subunits. g-i, Representative densities of the binding pockets formed by β(+)/α.A(−) (g), α.D(+)/β(−) (h) and α.B(+)/α.C(−) (i), respectively. The related key amino acids are labeled. j-k, Representative densities for transmembrane helices including M1, M2, M3 and M4 from β (j) and α.A (k), respectively. All of the isolated densities are contoured at 8σ.
