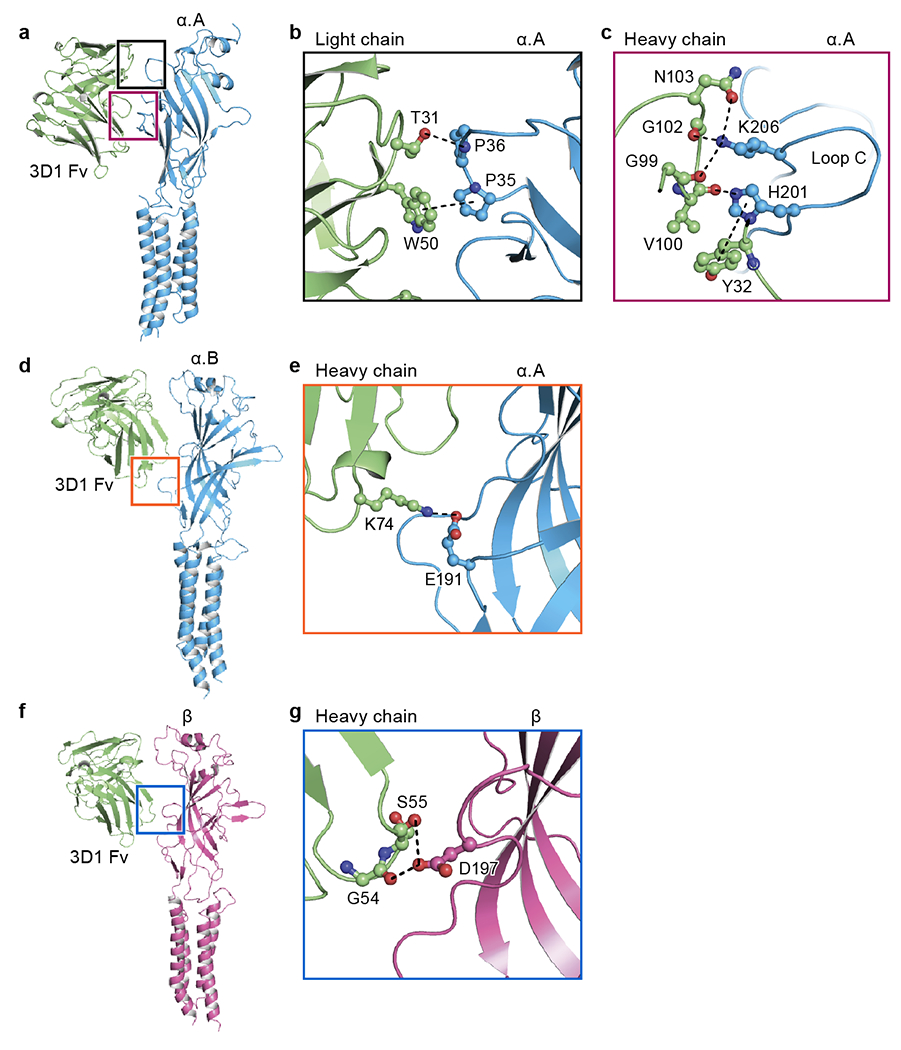
Extended Data Fig. 5. Binding of 3D1 Fab.

a, d, Side views of 3D1 Fab bound to the isolated α.A (a) and α.B subunit (d) in carton representation, respectively. b-c, e, Close-up view of the binding site of the region indicated in panel (a) and (d) viewed approximately parallel to the plane of the membrane. The key amino acids involved in interactions are shown in ball-stick representation. The potential hydrogen bonds, cation-π and π-π interactions are indicated in dashed lines. f, Side view of 3D1 Fab bound to the isolated β subunit in carton representation. g, Close-up view of the binding site of the region indicated in panel (f) viewed approximately parallel to the plane of the membrane.
