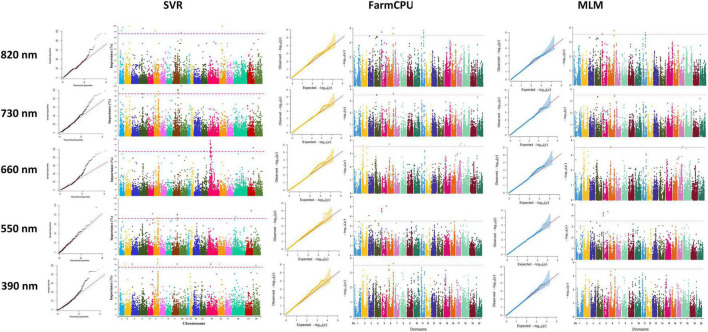
FIGURE 8.
Genome-wide Manhattan plots for GWAS studies of the selected hyperspectral reflectance bands using MLM, FarmCPU, and SVR methods in the tested soybean panel. MLM, mixed linear model; FarmCPU, fixed and random model circulating probability unification; SVR, fixed and random model circulating probability unification.

