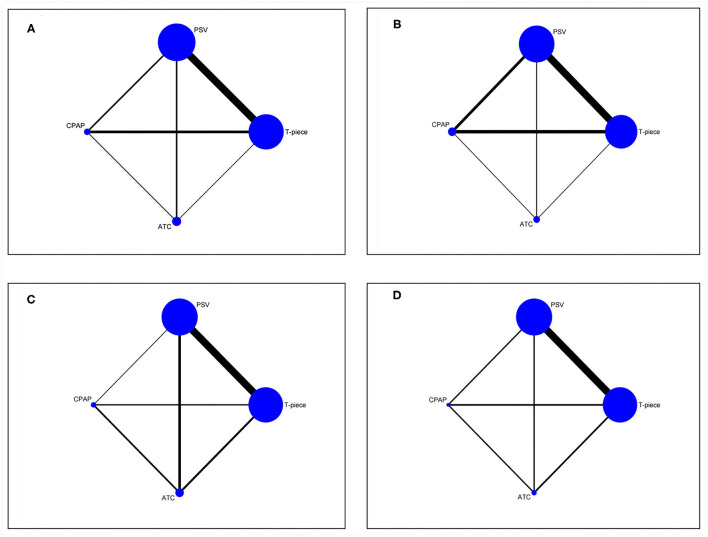
Figure 2.
Evidence structure of eligible comparisons for network meta-analysis. (A) weaning success. (B). reintubation. (C) SBT success. (D) ICU or LWU length of stay. All SBT techniques are represented as blue solid circles, and existing head-to-head (direct) comparisons are drawn as black solid lines. The size of every node is proportion to the number of randomly assigned participants (sample size) and the width of the lines is proportion to the number of RCTs for each pairwise comparison. PSV, pressure support ventilation; CPAP, continuous positive airway pressure; ATC, automatic tube compensation.

