Figure 1.

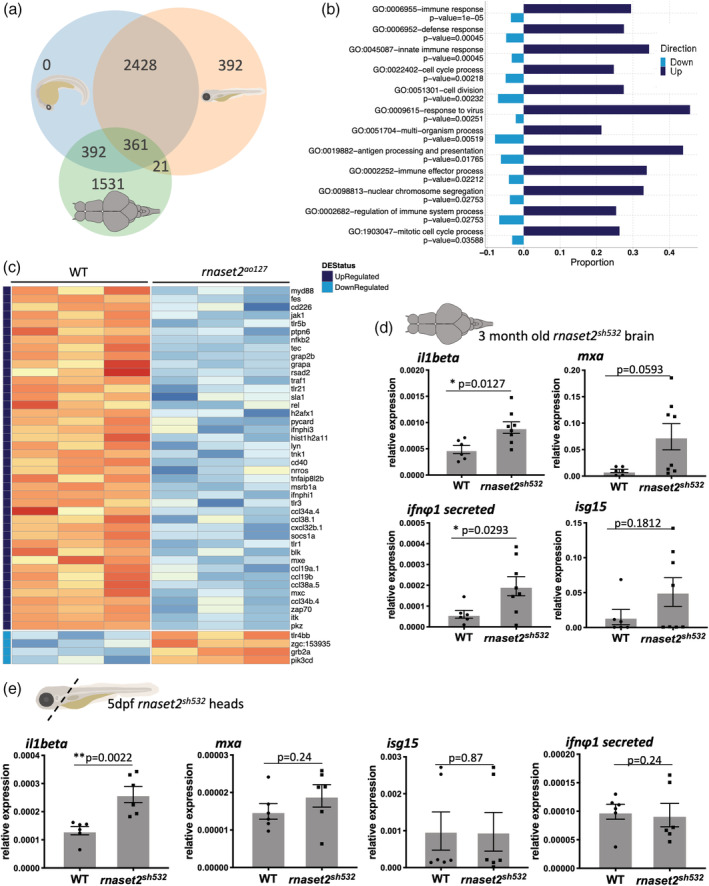
Loss of rnaset2 triggers an inflammatory response in the brain. (a) Venn diagram of differentially expressed genes across the three timepoints of rnaset2 AO127 mutant and wild type (WT) samples used for microarray experiment. (b) Differential expression (DE) graph showing the enriched pathways identified by clusterProfiler in adult brain. The proportion of individual genes belonging to each pathway is displayed in dark blue for upregulated and light blue for downregulated expression. The p‐value for the enrichment of each pathway is stated below the pathway name. (C) Heatmap of genes belonging to innate immune response GO pathway showing normalized expression values and all replicates of the adult timepoint. Genes are ordered according to the magnitude of difference between rnaset2 AO127 mutant and WT samples (with red indicating higher expression in mutant). Each row is annotated with the gene name and color‐coded bars at the top to indicate whether the gene is upregulated (dark blue) or downregulated (light blue) regulated, or not significant at the adjusted p‐value threshold of .05. The −10log of the adjusted p‐value is also shown. (d,e) Quantitative PCR (qPCR) analysis of inflammatory il1beta and antiviral response genes: mxa, isg15, ifnΦ1 from dissected brain of 3‐month‐old (d) and dissected heads of 5dpf (e) WT siblings and rnaset2 sh532 . Expression relative to two reference genes combined rpl13 and ef1α. n = 8 (d) and n = 6 (e), two‐tailed Mann–Whitney U test, p value shown on individual graphs [Color figure can be viewed at wileyonlinelibrary.com]
