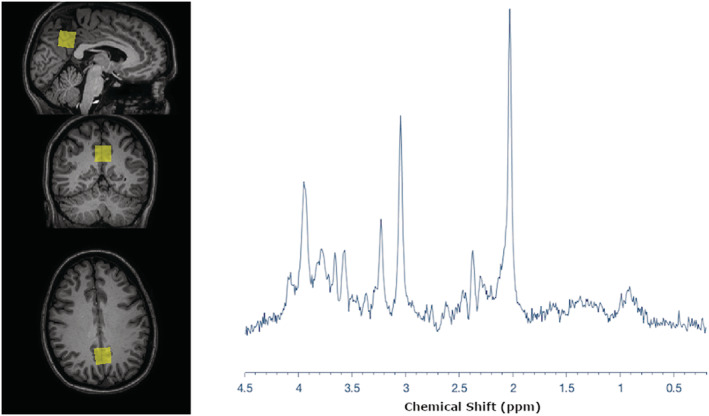
FIGURE 1.

Representative spectrum and voxel location. Representative PRESS spectrum from the posterior cingulate acquired on a 3 T Philips Ingenia. In this figure the raw data from one participant are shown; however, mean data with SDs, multiple data sets, and fitted data may also be shown, as long as the raw data are presented in a fashion that allows an assessment of data quality. The chemical shift axis is labeled in ppm units. Data were collected in accordance with the WMA Declaration of Helsinki
