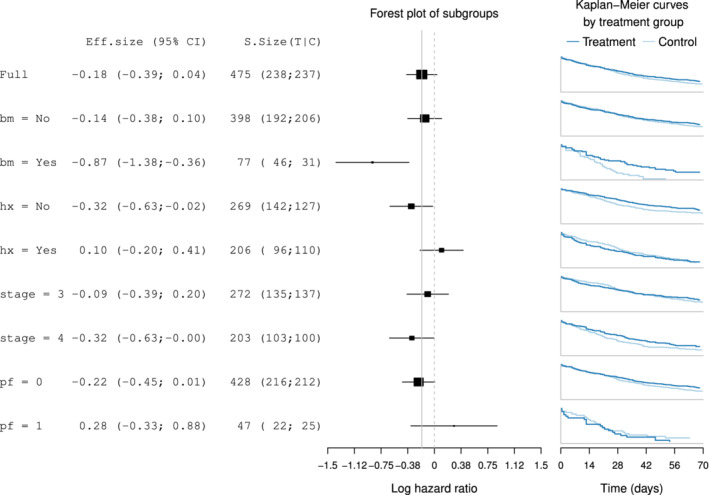
Figure 1.

Forest plot for subgroups defined by performance (pf), stage, history of cardiovascular events (hx), and existence of bone metastasis (bm). Effect sizes in terms of the log‐hazard ratio and associated treatment and control group Kaplan‐Meier curves are displayed
