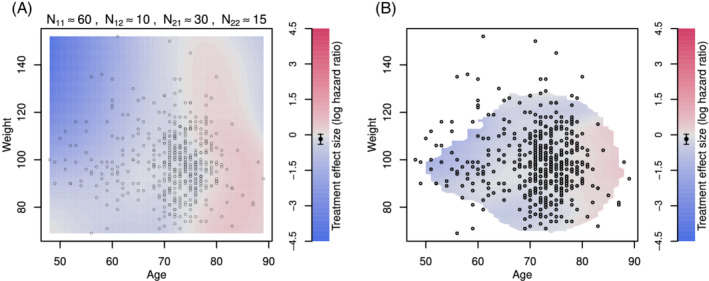
Figure 6.

Contour plot of treatment effect in terms of the log‐hazard ratio over the plane of age and weight. A, Contour lines are drawn by forming subgroups with neighboring subjects, calculating the treatment effect for subgroups and interpolating the results using loess. N 11 stands for the sample size of a marginal subgroup defined by a range of age, N 12 is the overlap size of the immediate marginal subgroups on age, N 21 is the sample size of the subset of a marginal subgroup on age but further defined by a range of weight, and N 22 is the overlap size of the immediate subgroups (which are the subset of a marginal subgroup on age) on weight. B, Contour lines are drawn by fitting a local regression at each point of the grid, using subjects weights according to their distance to the point of the grid. Points with few subjects in the vicinity of the grid point were left blank
