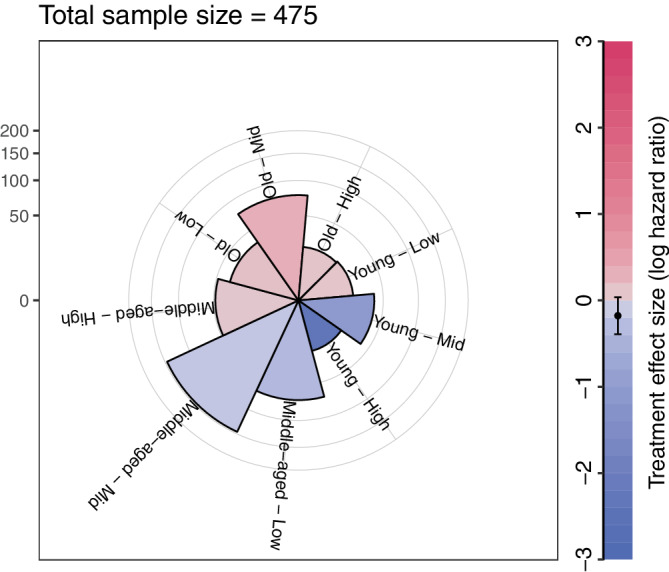
Figure A8.

Nightingale coxcombs plot for subgroups defined by age and weight. The colours represent the treatment effect in terms of the log‐hazard ratio. The radius of the sectors are proportional to the square root of the sample sizes in the subgroups
