
Figure 1.
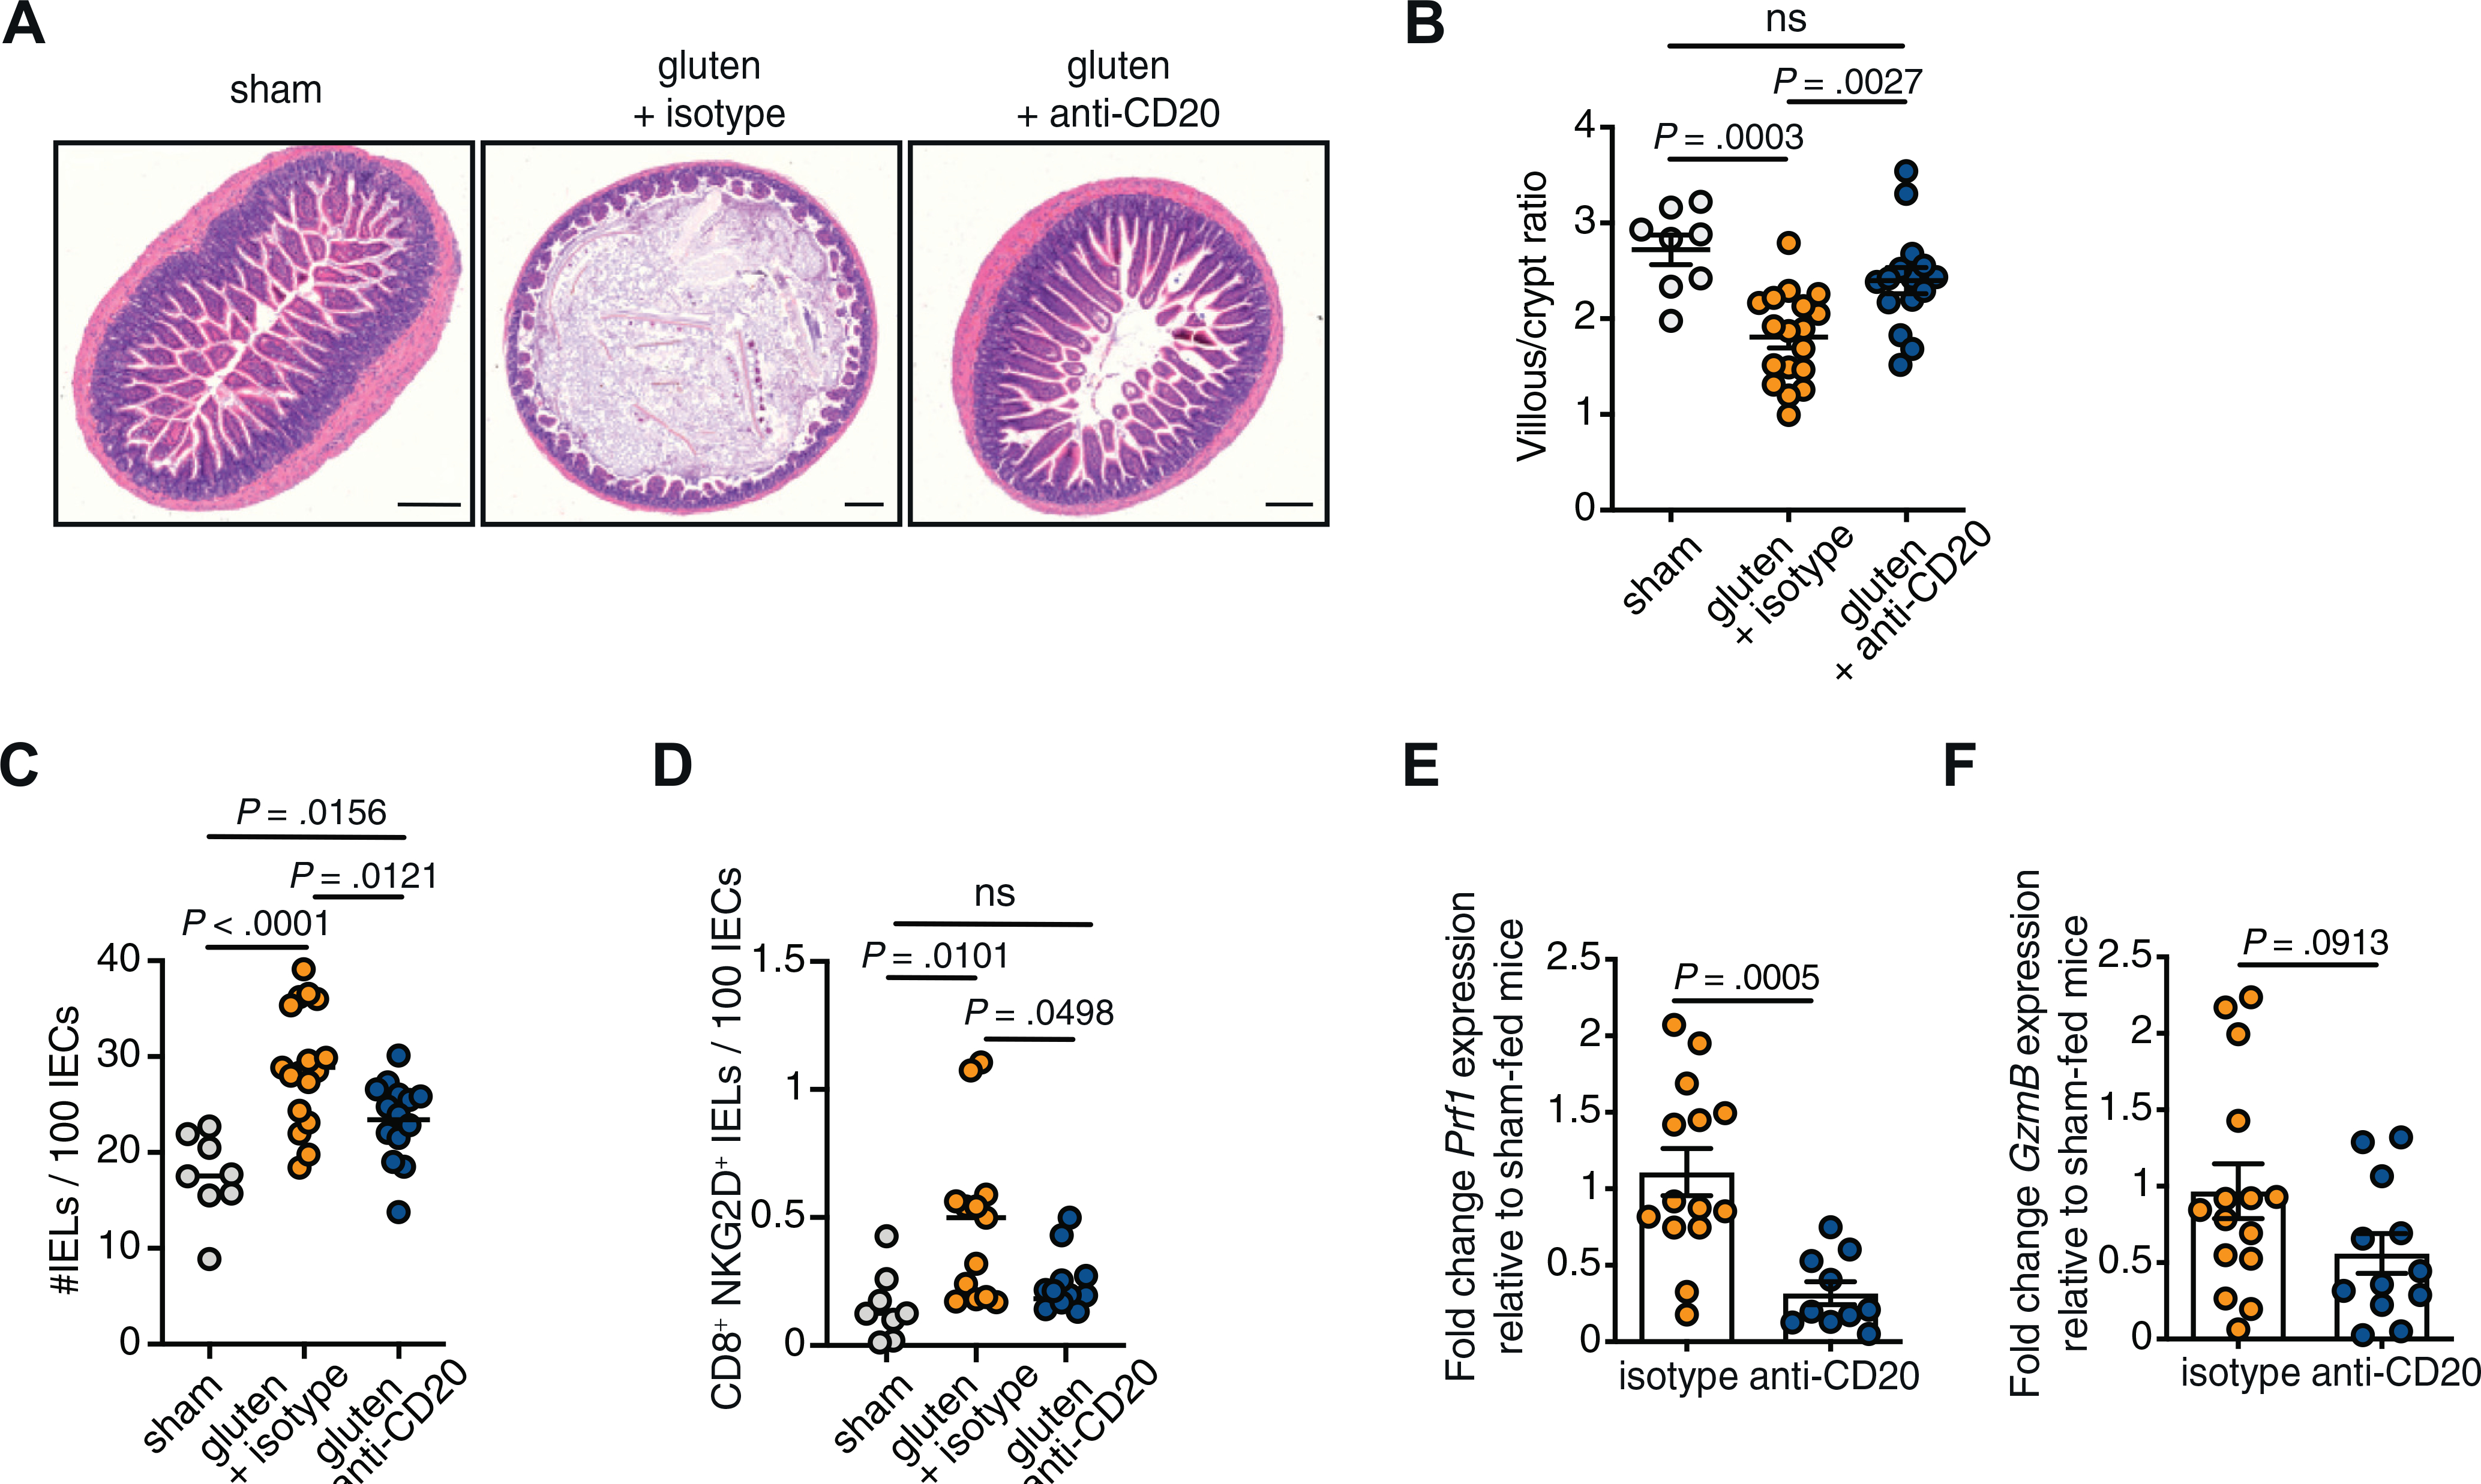
The development of villous atrophy and the acquisition of cytotoxic properties by intraepithelial CD8+ T cells in DQ8-Dd-villin-IL-15tg mice is impaired in the absence of B cells. DQ8-Dd-villin-IL-15tg mice were maintained on a gluten free diet (sham), or fed with gluten every other day for 30 days and treated with 250 μg anti-CD20 antibody (gluten + anti-CD20) or its isotype control (gluten + isotype) every 2 weeks. (A) Hematoxylin-stained ileum sections showing villous atrophy—as evidenced by villous height-to-crypt depth ratio ≤2—in the gluten-fed DQ8-Dd-villin-IL-15tg mice. Scale bar = 250 μm. (B) Morphometric assessment of the villous height-to-crypt depth ratio demonstrating villous atrophy in gluten-fed mice (ratio ≤2) compared with sham-fed mice and gluten-fed mice treated with the anti-CD20 antibody. (C) Quantification of intraepithelial lymphocytes (IELs) among intestinal epithelial cells (IECs); mean. (D) The intestinal epithelium was isolated and analyzed by flow cytometry. IELs were identified as TCRβ+ CD4− CD8+ cells, and the frequency of CD8+ NKG2D+ TCRαβ+ cells were obtained. The total amount of IELs per 100 IECs was determined on hematoxylin and eosin–stained slides. NKG2D+ NKG2− IELs are indicated by absolute number per 100 IECs. (E) The expression of perforin (prf1) in the epithelial compartment was measured by quantitative polymerase chain reaction. Relative expression levels in gluten-fed mice were normalized to the expression levels observed in sham-fed mice. (F) The expression of granzyme B (GzmB) was measured as in E. Data are representative of 5 (B, C) or 4 (D–F) independent experiments, shown as mean ± SEM; ANOVA/Tukey multiple comparison was performed for B, C, and D. Unpaired Student t test was used for E and F.