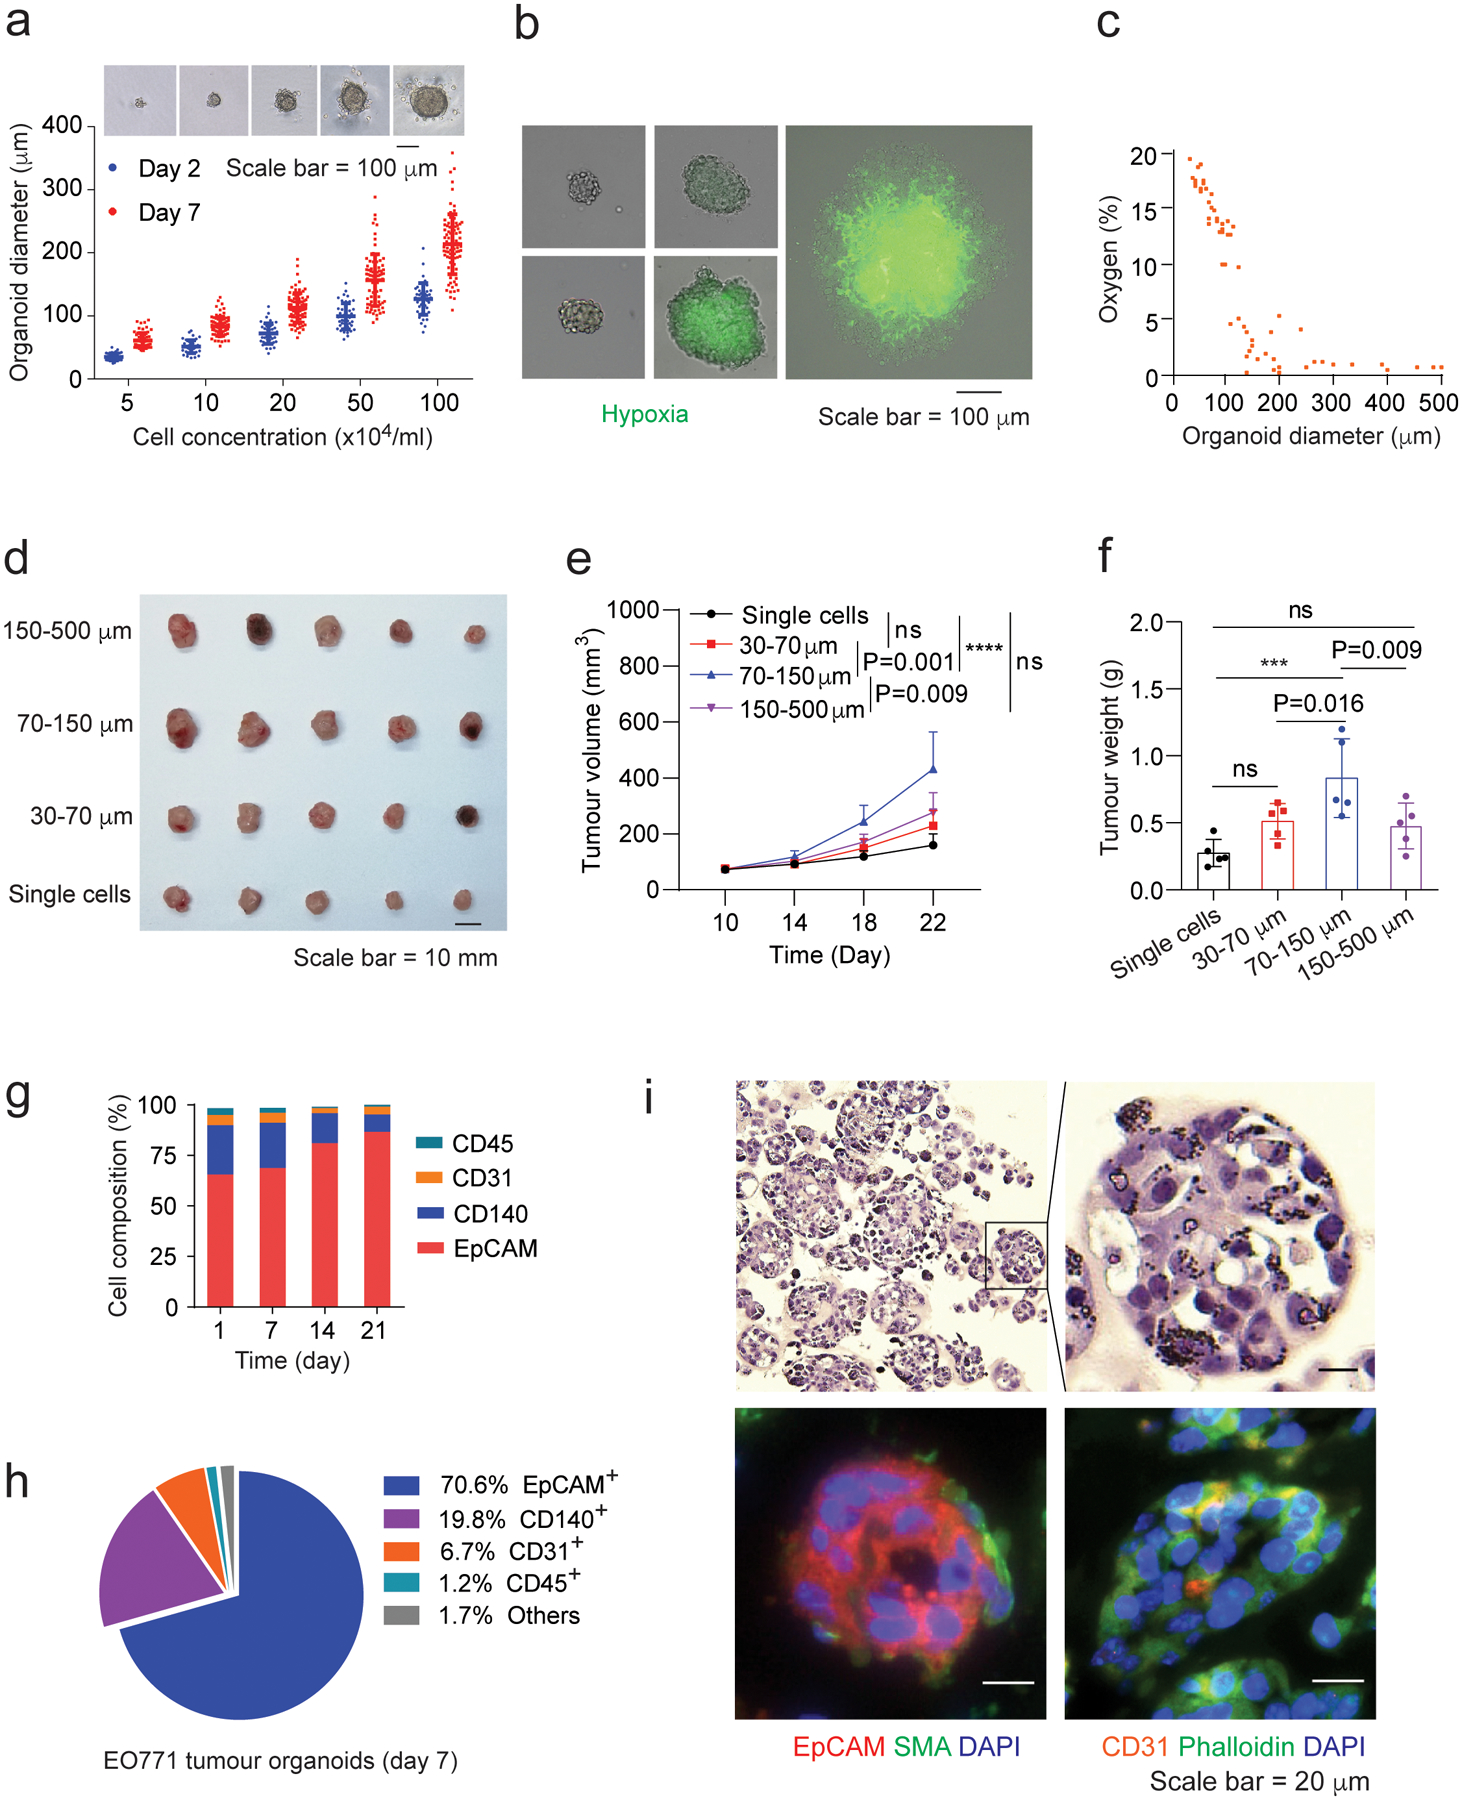
Fig. 2 |. Characterization and optimization of mouse breast tumour organoids.

a,Organoid diameter versus cell seeding concentration at day 2 and day 7 of organoid culture. Optical images show tumour organoids at day 7. Optical images were analyzed using ImageJ to determine the organoid size. b, Hypoxia characterization of the EO771 tumour organoids under optical and fluorescence light. Image-iT Green Hypoxia reagent was used to show hypoxia in tumour organoids. The merged images with optical light and fluorescence were captured under a Leica DM4B microscope with two channels (optical light and 488 nm excitation). c, Oxygen levels in tumour organoids determined by hypoxia-caused fluorescence intensity from Supplementary Fig. 2b according to the protocol of the Image-iT Green Hypoxia reagent. d, Breast tumours derived from transplanted tumour organoids with indicated sizes. Tumour organoids containing 2 × 10⁵ tumour cells were injected into each mouse and the resulting tumours were harvested 22 days post injection. e,f, Growth (e) and weight (f) of the tumour organoid-derived breast tumours. g, Cellular composition of the EO771 tumour organoids with indicated culture times. 20,000 events per cell sample were collected. The data were analyzed from 3 biologically parallel experiments. h, The typical cellular composition of the EO771 tumour organoids at day 7 of culture. i, H&E staining (upper panels) and immunofluorescent staining (bottom panels) of the EO771 tumour organoids. One-way ANOVA test was used for statistical analysis(e,f). Data are presented as mean ± SD. ***, p < 0.001; ****, p < 0.0001; ns, no significance.
