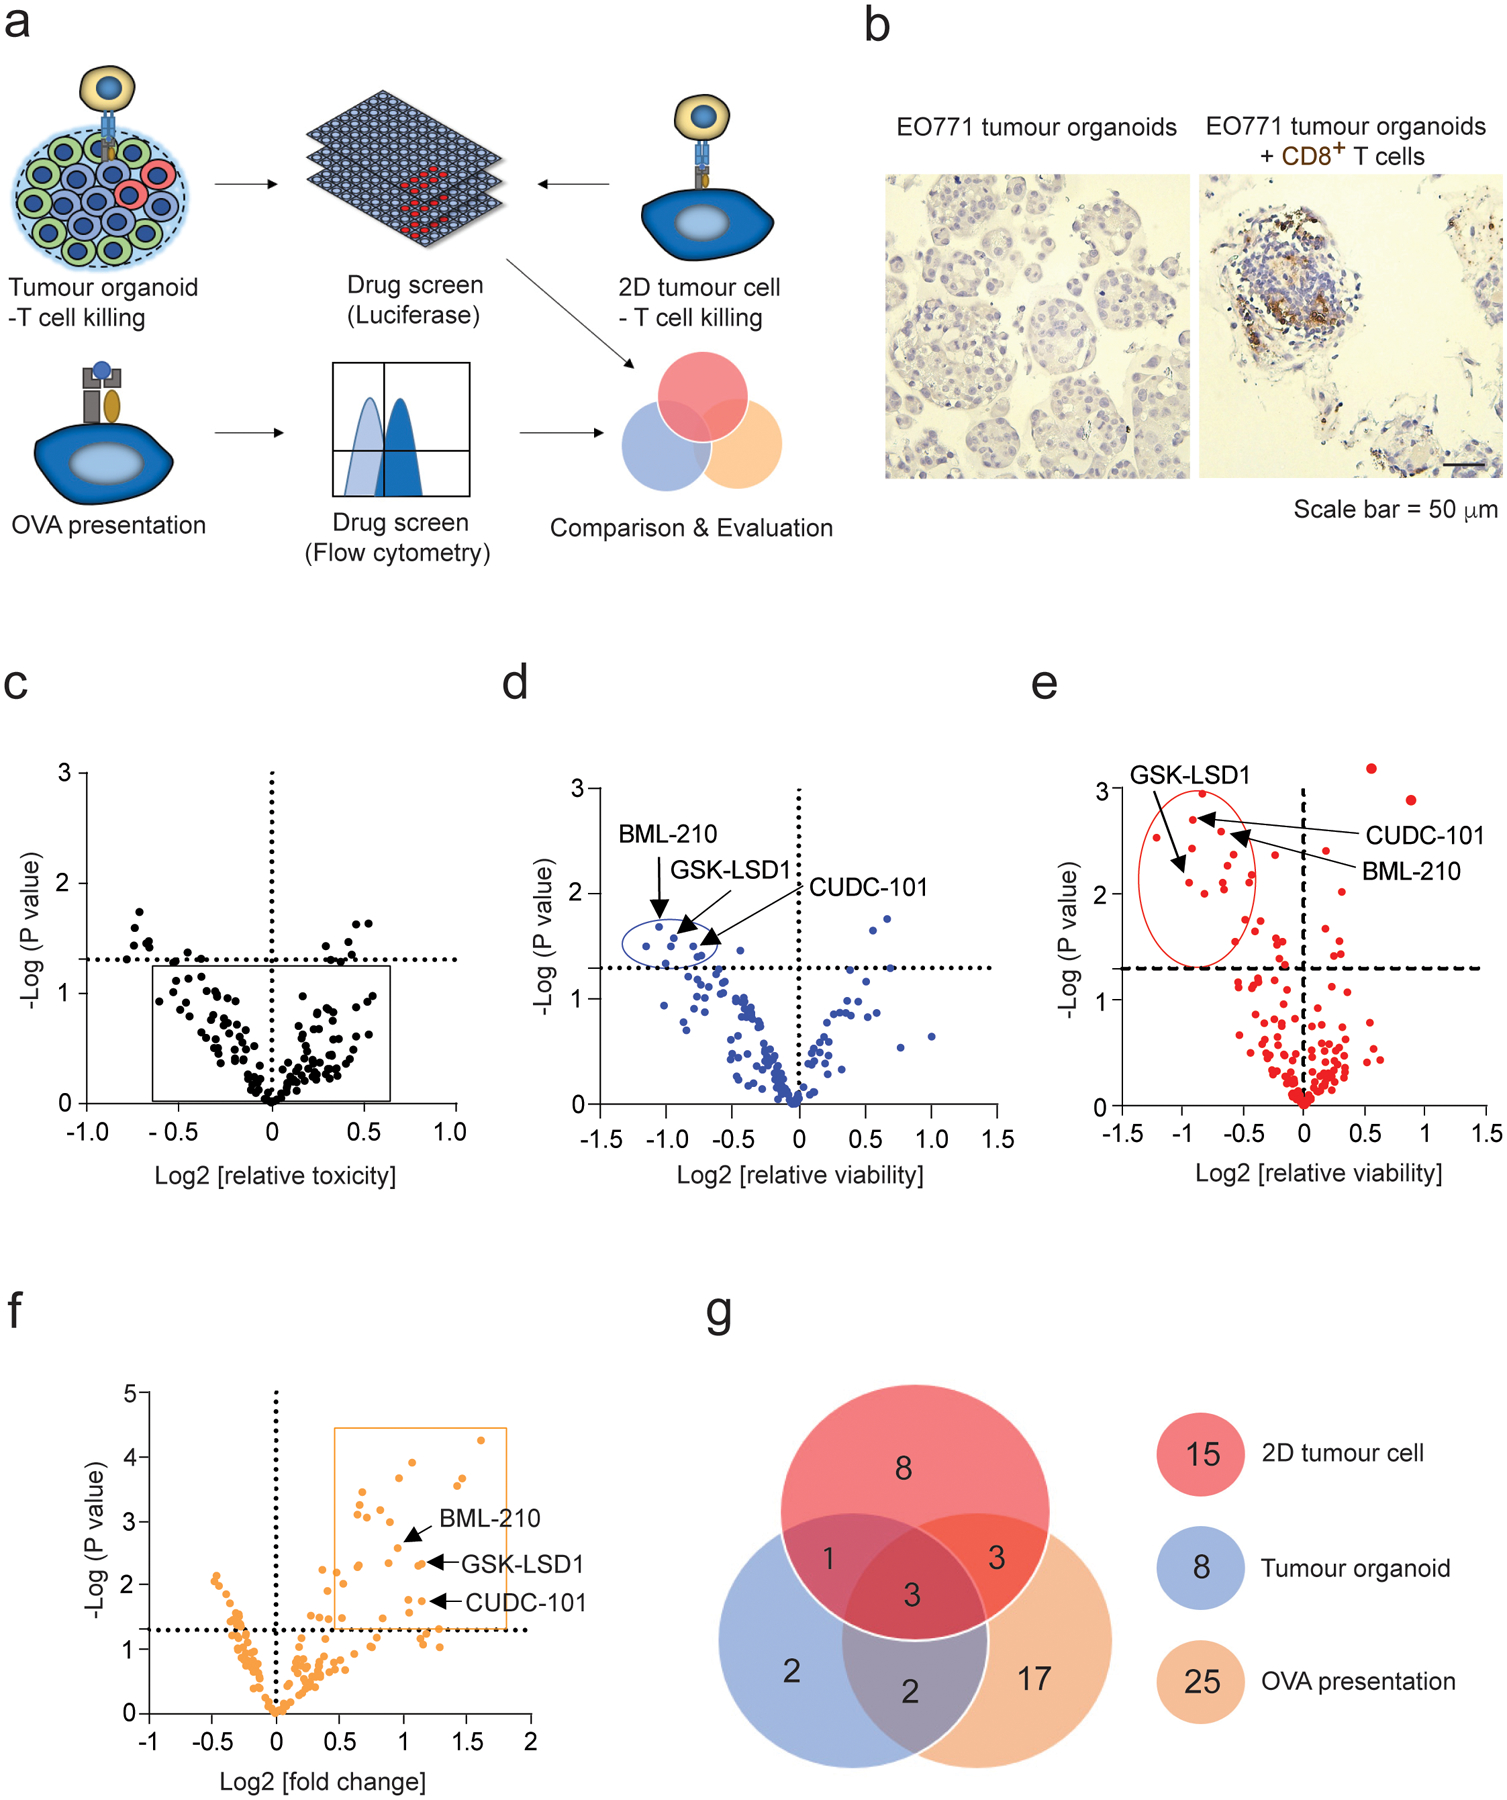
Fig. 3 |. Screening of epigenetic inhibitors that enhance T-cell-mediated tumour-cell killing.

a, Schematic illustration of epigenetic drug screening based on 3D tumour organoid culture, 2D tumour cell culture, and antigen presentation on the 2D cultured tumour cells. b, Immunohistochemical (IHC) staining of CD8+ T cells in the EO771 organoids co-cultured with and without CD8+ T cells. CD8+ T cells are stained in brown colour. c, Volcano plot analysis of epigenetic inhibitors’ toxicity for the tumour cells in EO771 (Luc+OVA+) tumour organoids at the concentration of 1.0 μM. The compounds without substantial toxicity effect in the absence of CD8+ T cells were shown in the square. d, Volcano plot analysis showing the effect of epigenetic inhibitors on the CD8+ T cell-mediated cytotoxicity in the co-culture with the EO771 tumour organoids. The EO771 tumour organoids were treated with epigenetic inhibitors for 48 h and then co-cultured with CD8+ T cells for 24 h. Compounds shown in the circle significantly promoted T cell-mediated cytotoxicity (log2[relative viability] < −0.5; p < 0.05). Relative viability = (tumour cell viability of treated group)/(tumour cell viability of control group). e, Volcano plot analysis showing the effect of epigenetic inhibitors on the CD8+ T cell-mediated cytotoxicity for the EO771 (Luc+OVA+) cells in 2D culture. Compounds shown in the circle significantly promoted T cell cytotoxicity (log2[relative viability] < −0.5; p <0.05).The cytotoxicity in (d) and (e) was quantified using luciferase assay. f, Volcano plot analysis showing the effect of epigenetic inhibitors on OVA antigen presentation of the EO771 (Luc+OVA+) cells. Compounds shown in the rectangle significantly promoted OVA antigen expression (log2[OVA presentation/control] > 0.5; p < 0.05). 10,000 events per cell sample in flow cytometry were collected for data analysis. The mean fluorescence intensity (MFI) from the cells stained with APC-conjugated OVA peptide SIINFEKL antibody represents the OVA expression levels. g, Pie chart of positive compounds screened from the three screening methods. One-way ANOVA test was conducted in c-f. p value < 0.05 in the volcano plots was considered as significant difference. The data for the drug screen represent 3 biologically parallel experiments.
